Explorer Trending And Visualizations
How do I create trend charts or data visualizations in Timebase?
Timebase Explorer Overview#
Timebase Explorer is the main interface for reviewing, comparing, and analyzing data stored in the Timebase Historian, and from Timebase 2.0 the values Atlas computes as well.
Video - Timebase Explorer overview. A link will be added here once the recording is published.
A trend is a tab, and the tab has three major parts:
- The trend header across the top, with the trend's name and its save, refresh and view controls
- The Context band across the upper third of the tab, with the Frames ruler beneath it
- The Bands across the remaining screen
The pattern of use is simple. Use the Context band to choose and compare time periods, then use the Bands to inspect those periods in detail.
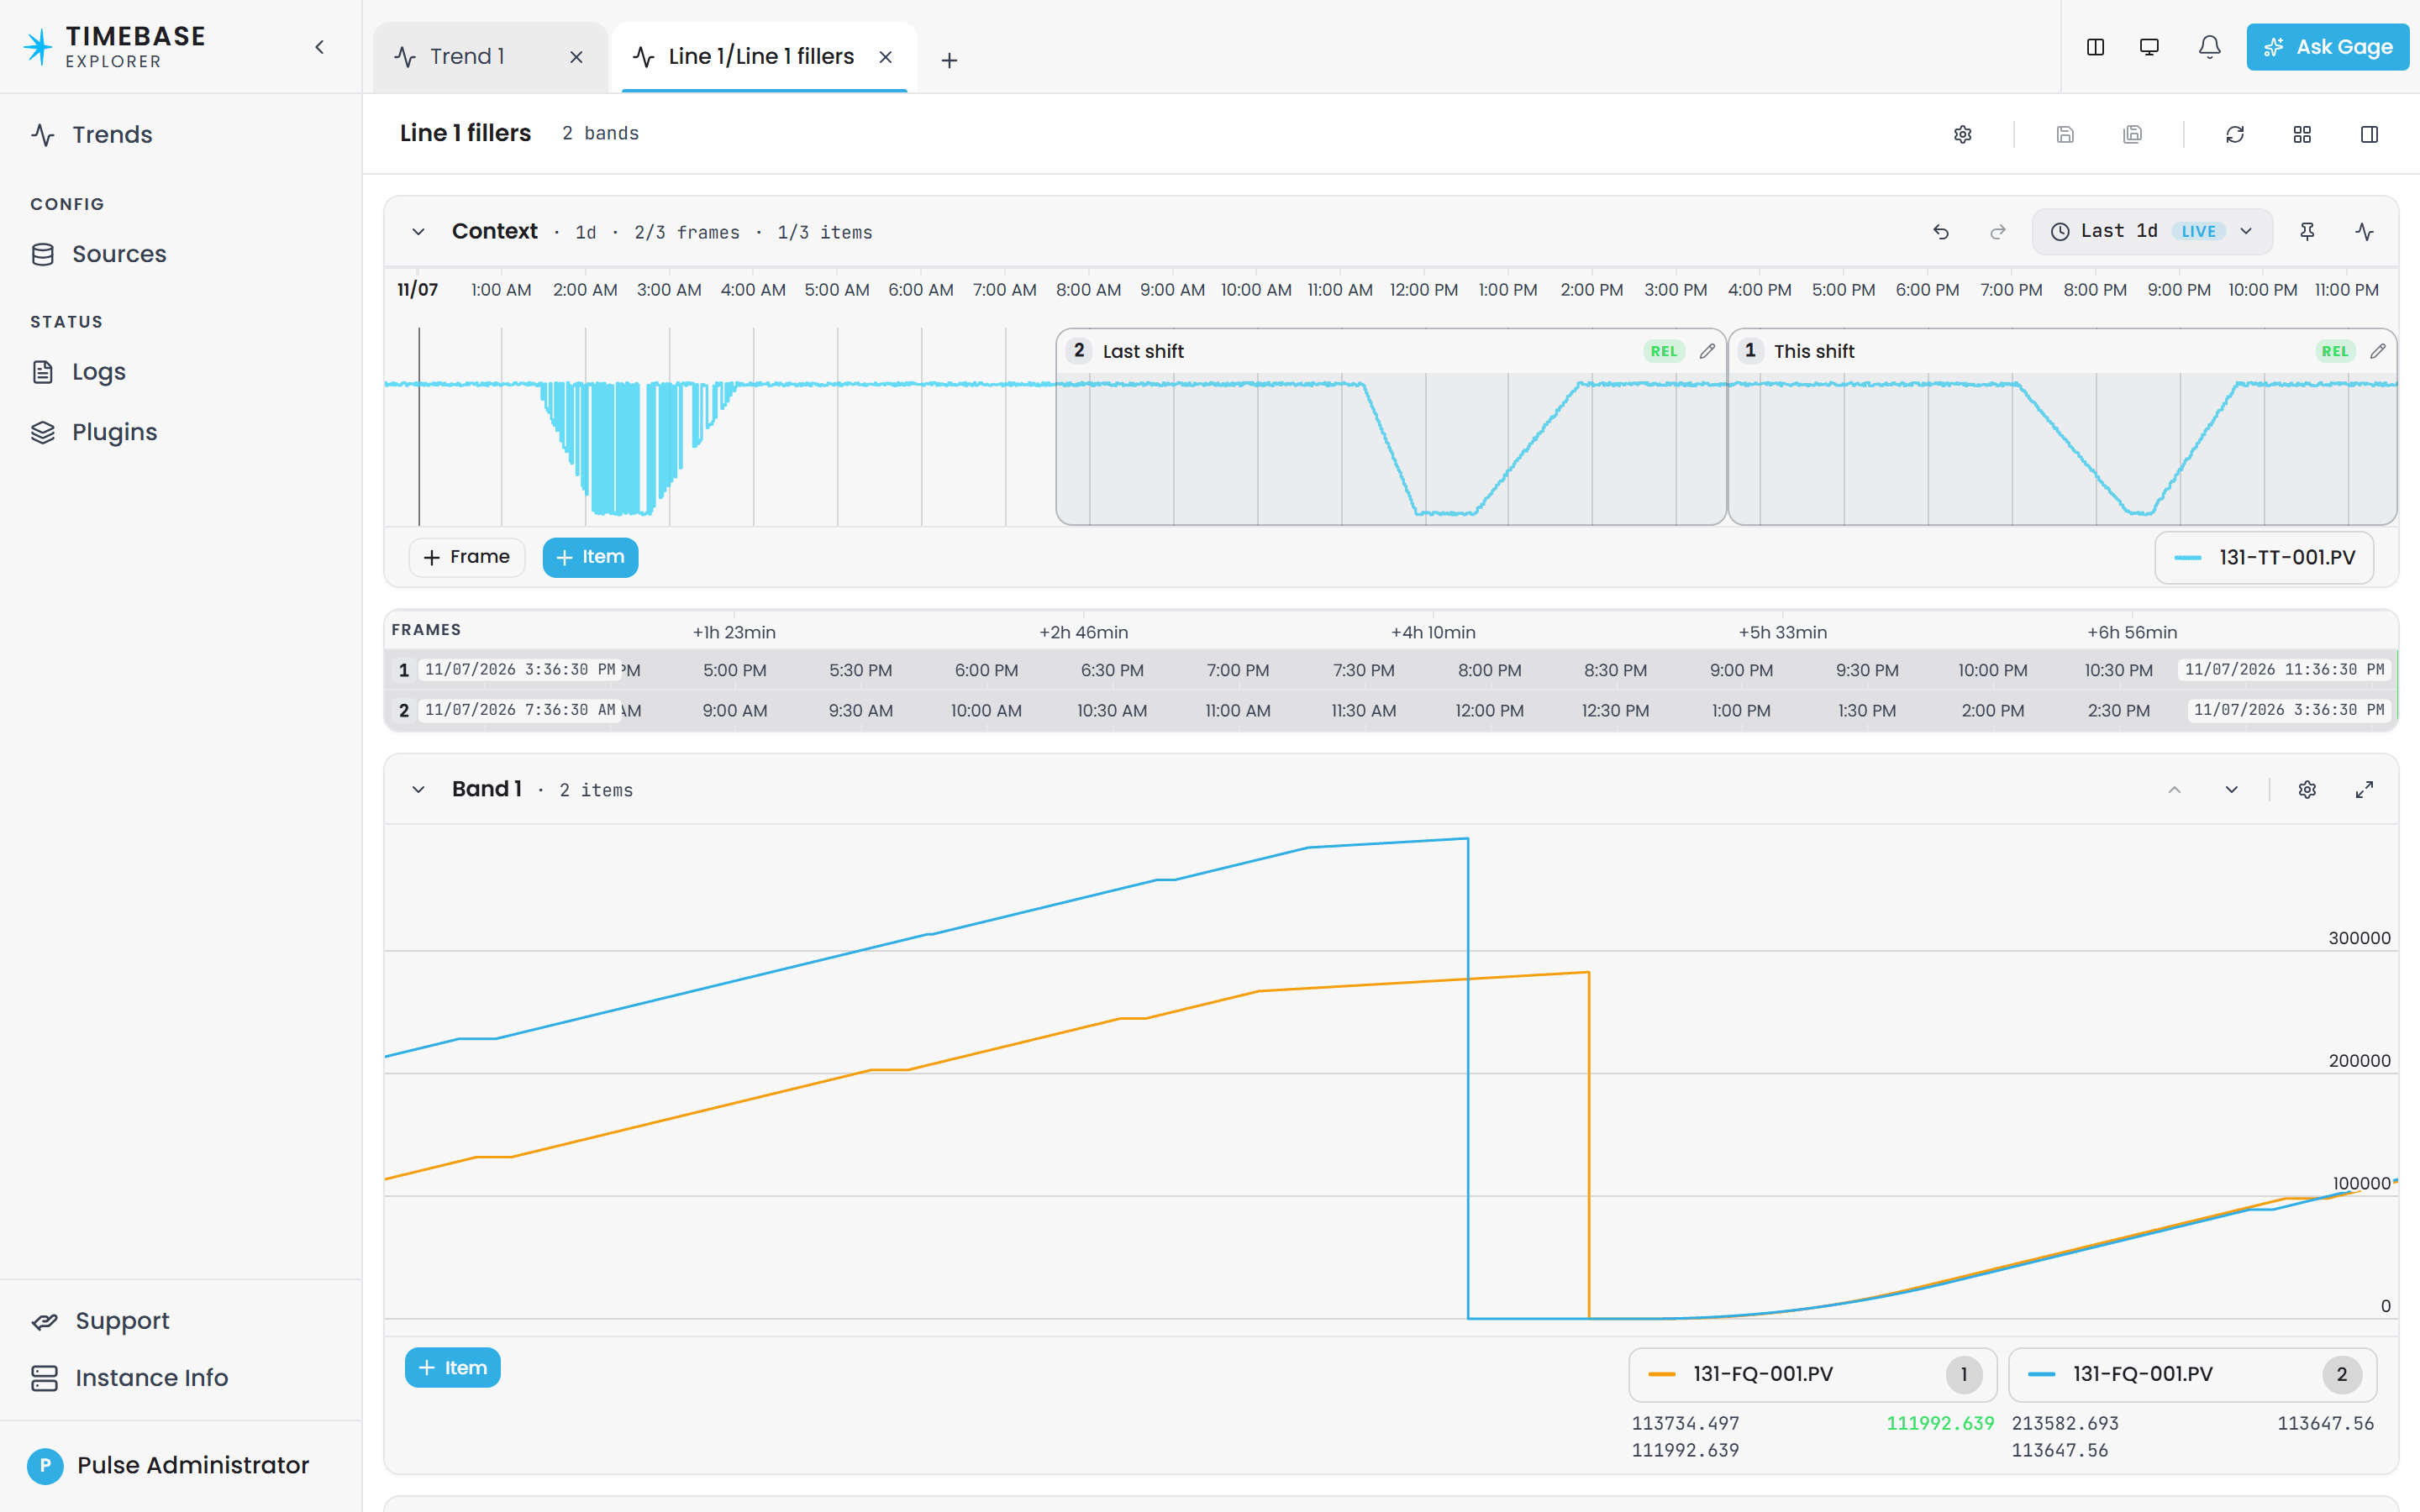
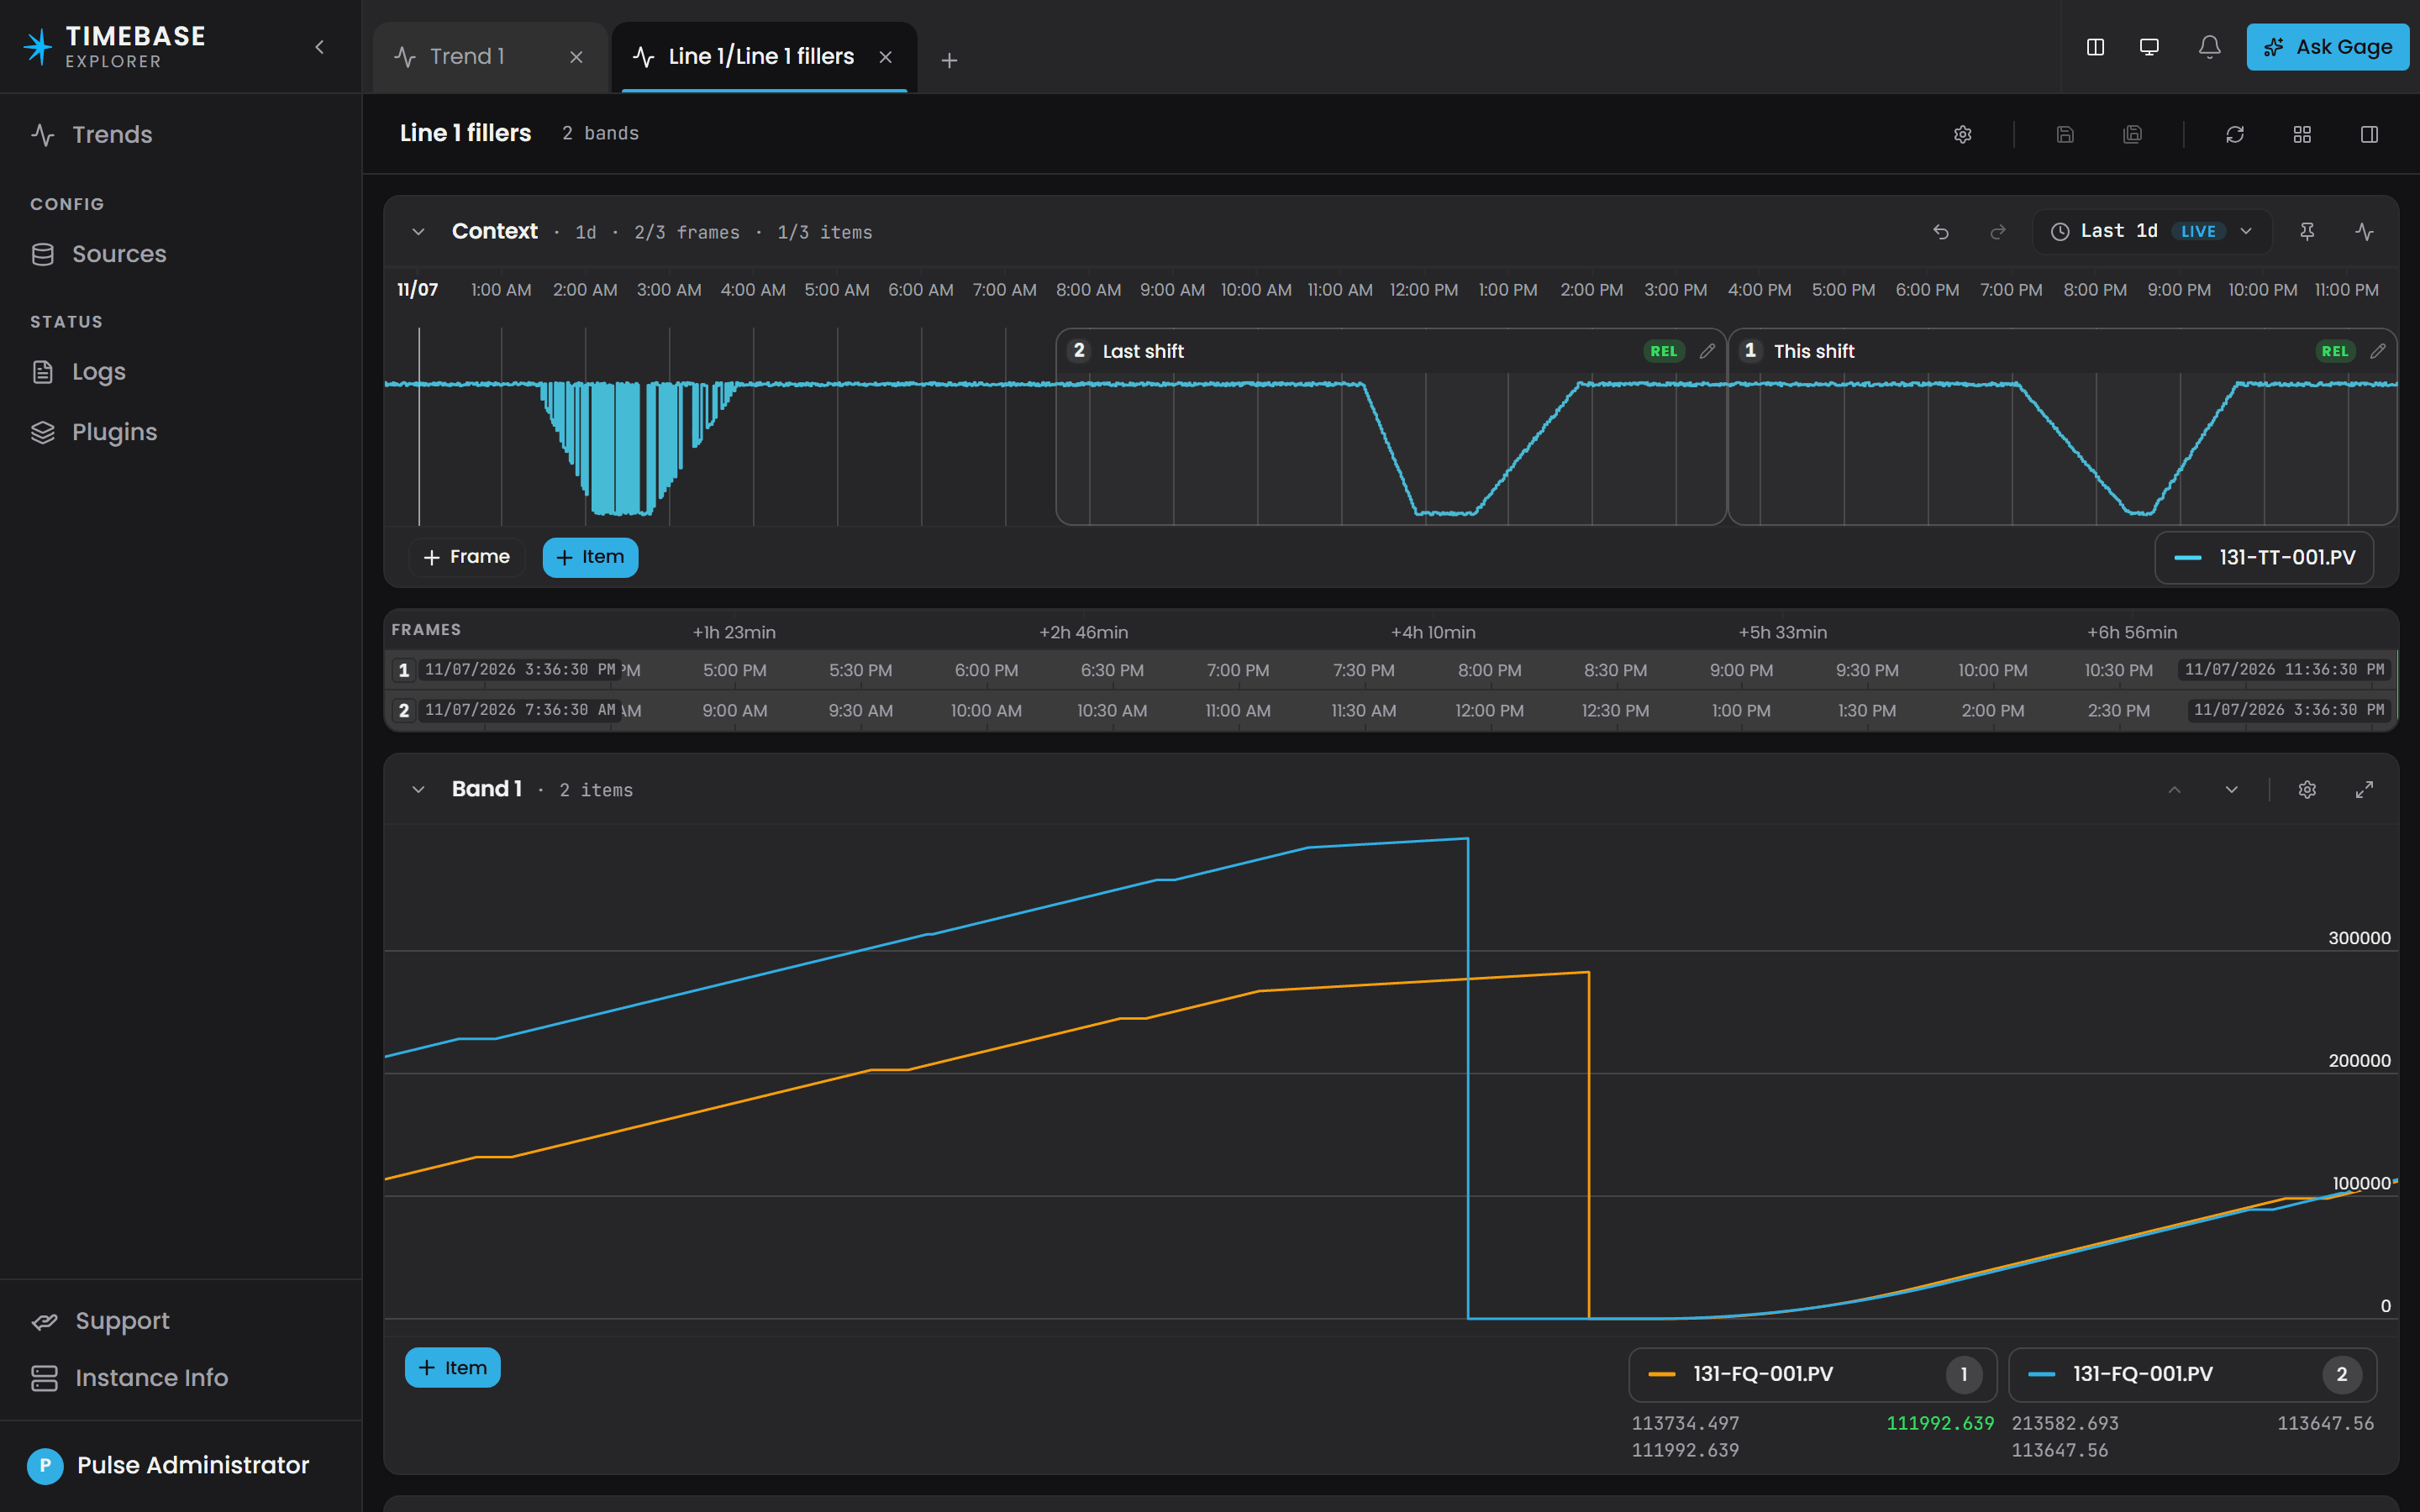
A saved trend open in its tab. The Context band carries two relative frames; Band 1 plots one tag once per frame, so the two shifts sit on top of each other.
Configuring Explorer#
Explorer reads from one or more sources: a Timebase Historian, or a Timebase Atlas. Sources are managed in the interface, under Config > Sources in the sidebar. Each source shows its status and uptime, and offers Start, Edit and Restart. Add Source adds another of either kind.
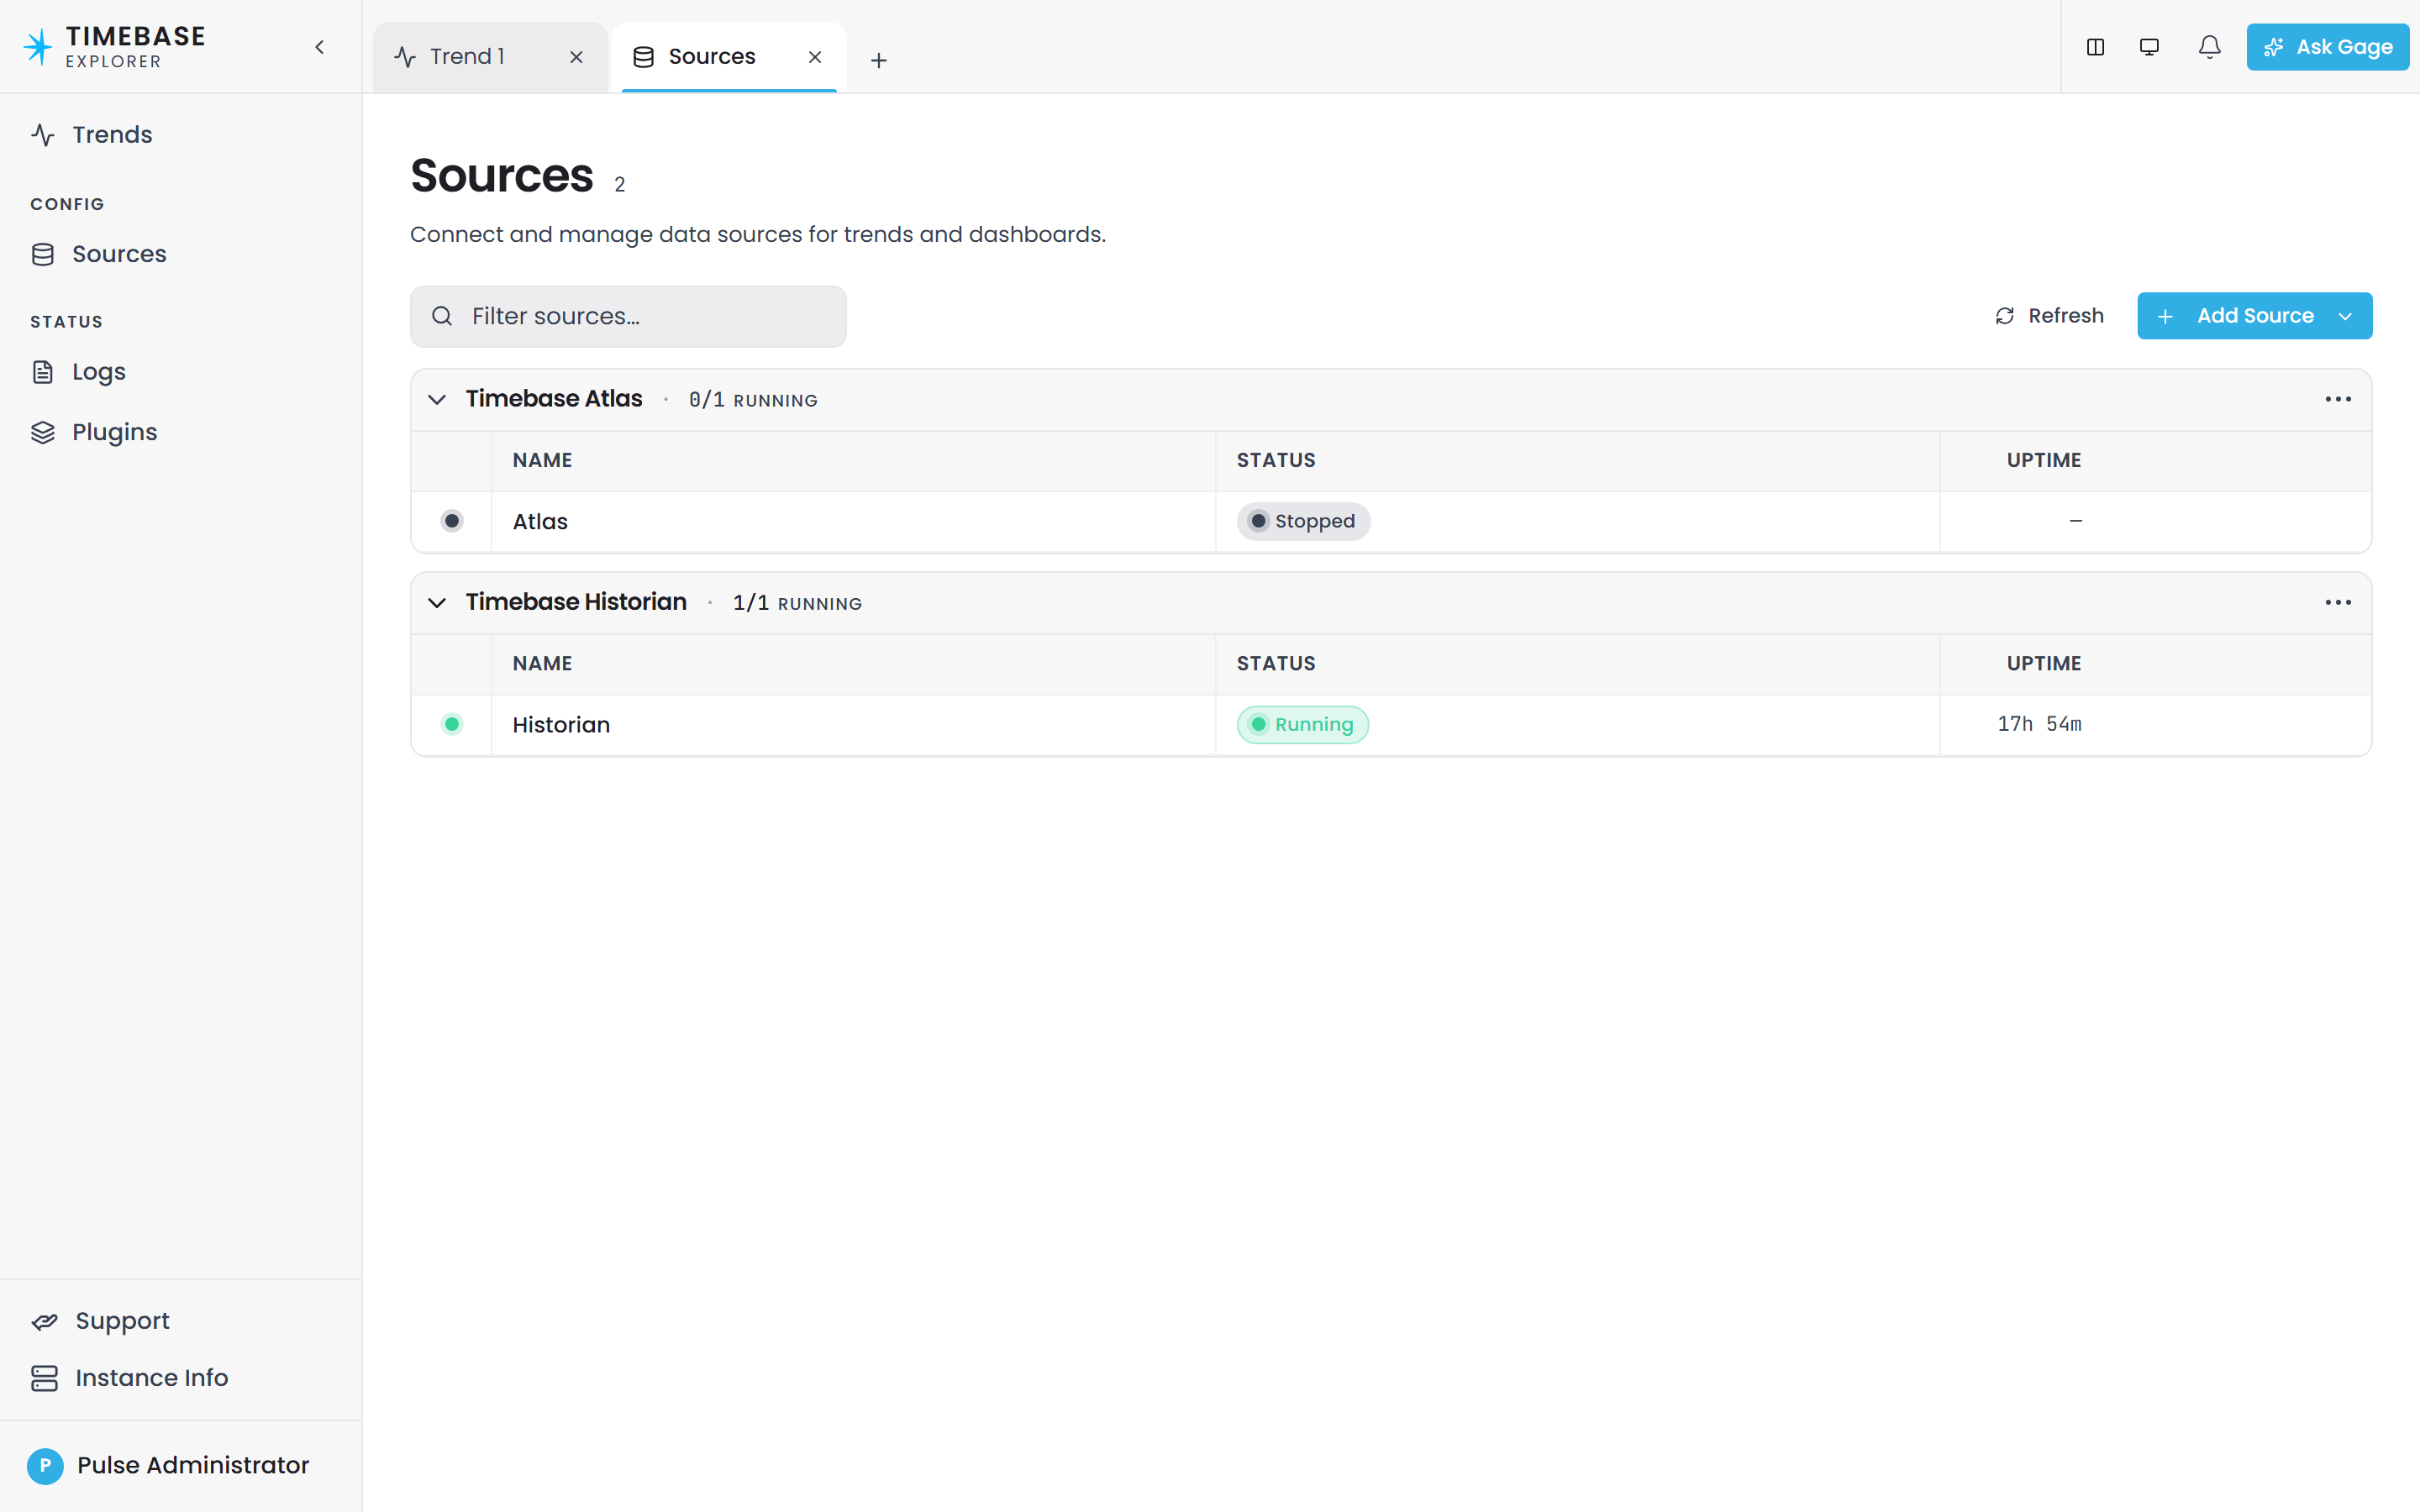
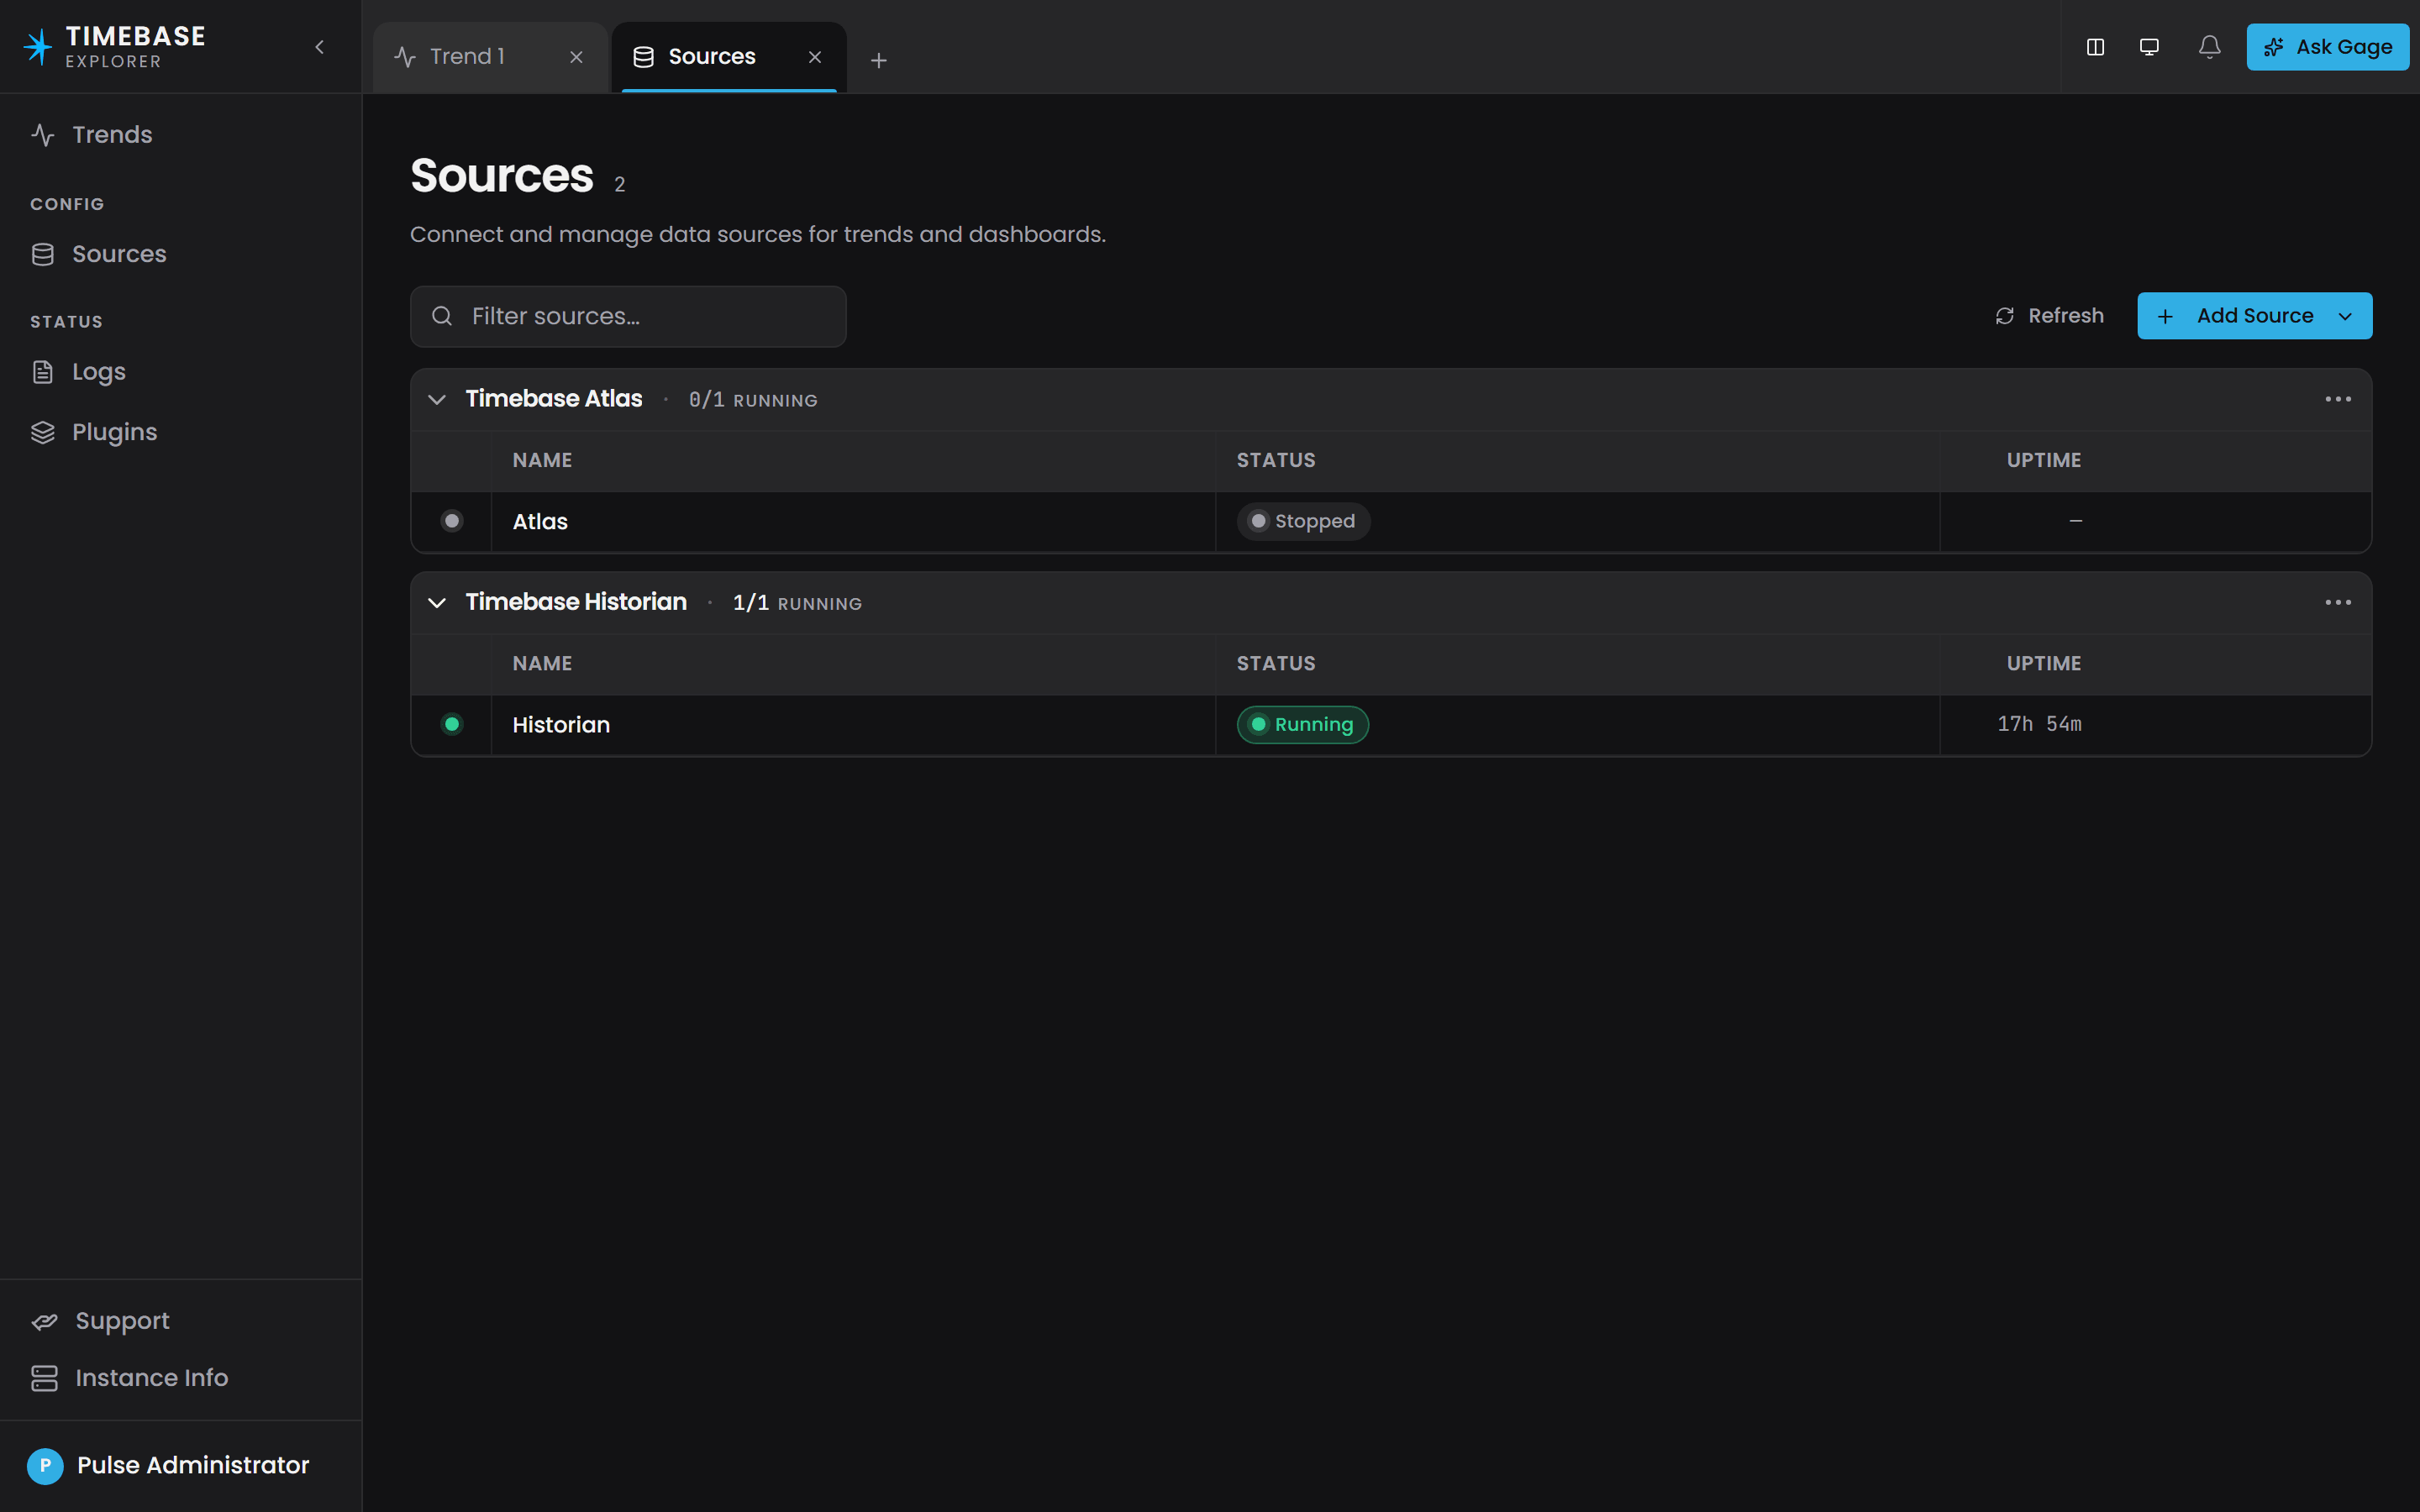
A source's properties have a General tab, with its Name, Host, Port and Use TLS switch, and an Authentication tab for the Pulse client it signs in with. Test checks the connection before you save. The sources are stored in Config/sources.config in Explorer's data folder, which is C:\ProgramData\Flow Software\Timebase\Explorer on Windows and the /explorer/config volume on Docker; editing the file by hand is only needed when the interface cannot reach the server, as Docker Network Settings describes.
From Timebase 2.0 the timebase/explorer image no longer runs as root. It runs as the unprivileged user app (uid 1654), so a volume written by an earlier release, which ran as root, is not writable by it and Explorer exits with a message naming the directory. The Compose files we provide carry a volume-init service that hands the volume over on every start. If you run the image any other way - your own Compose file, docker run, a bind mount, Kubernetes - do it once yourself before starting the 2.0 image: see Timebase 2.0 Release Notes.
A source that names no Pulse client of its own signs in as Explorer itself, with the client secret you supplied on Explorer's own setup page. The default Docker stack ships this way, so a fresh install needs no credentials typed into a source.
Launching Explorer#
Open https://<your-server>:4532 in your browser, for example https://localhost:4532 on the machine Explorer runs on. Explorer sends you to Pulse to sign in and brings you back to a new, empty trend.
Video - Launching Explorer. A link will be added here once the recording is published.
Explorer Components#
The trend header#
Every trend is a tab, and + on the tab bar opens another empty one. The header under the tabs shows the trend's title, which starts as Trend 1, and how many bands it has. A dot after the title means the trend has unsaved changes.
On the right are the trend's controls:
- Trend settings opens the trend's title, description and the folder it is stored in. Managing and Deleting Folders and Trends covers saving in full.
- Save trend and Save as a new trend.
- Refresh data asks the sources again.
- Show table switches the bands for the Data Table, and Show charts switches back.
- Show value rail opens the Aggregates panel beside the bands.
Saved trends are opened from Trends in the sidebar.
Context band#
The Context band sits under the trend header and provides the high-level time span. Its header shows the span, how many of the three frames and three items are in use, and Undo and Redo for changes to the frames.
Video - The Context band. A link will be added here once the recording is published.
The time range control on the right sets the span. Relative offers presets from the last five minutes to the last thirty days and a custom Last N of any unit, and keeps the span moving with the clock; Absolute pins a start and an end. Beside it, the pin recentres the span on NOW, and the pulse icon switches live streaming on and off.
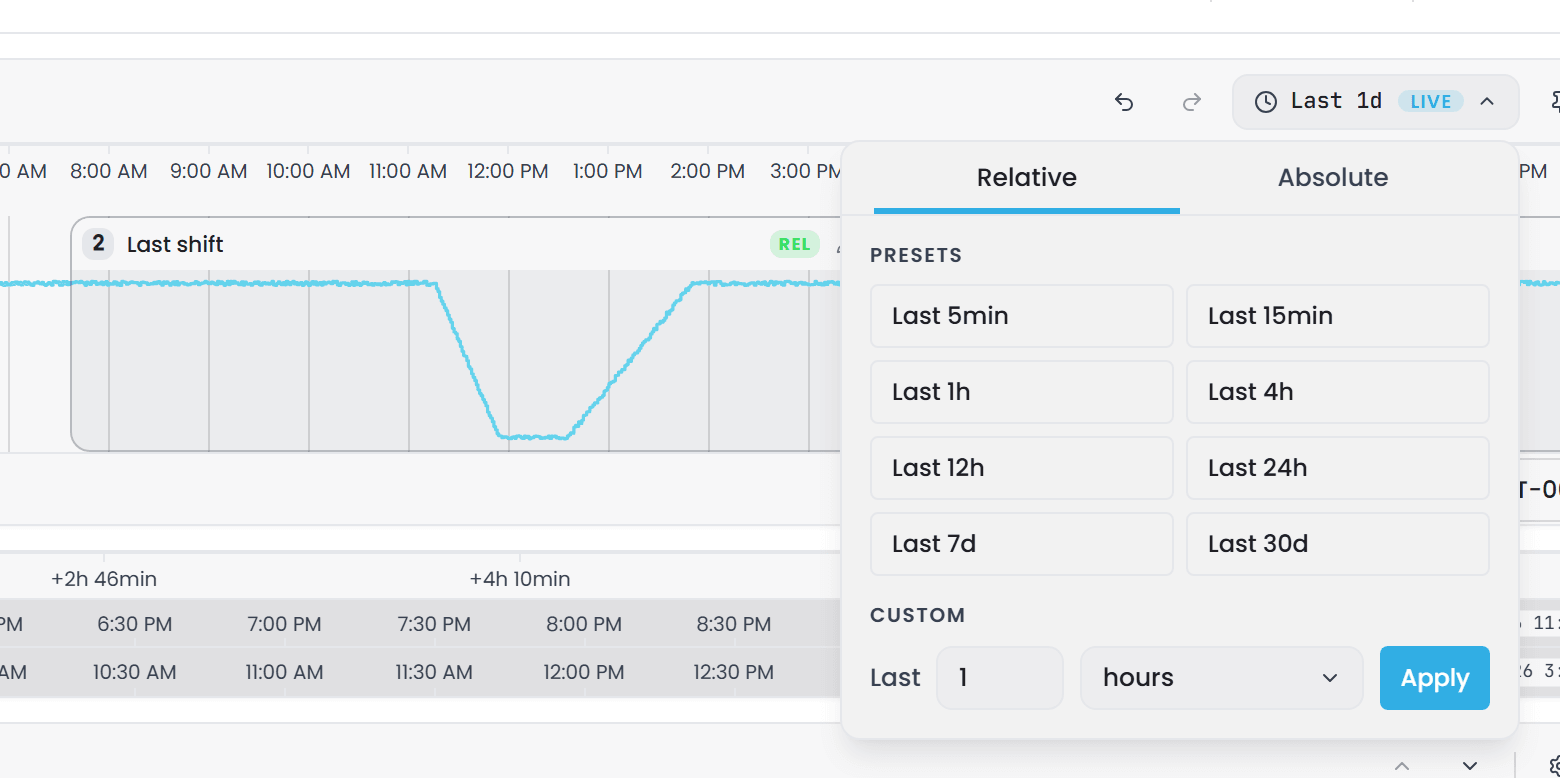
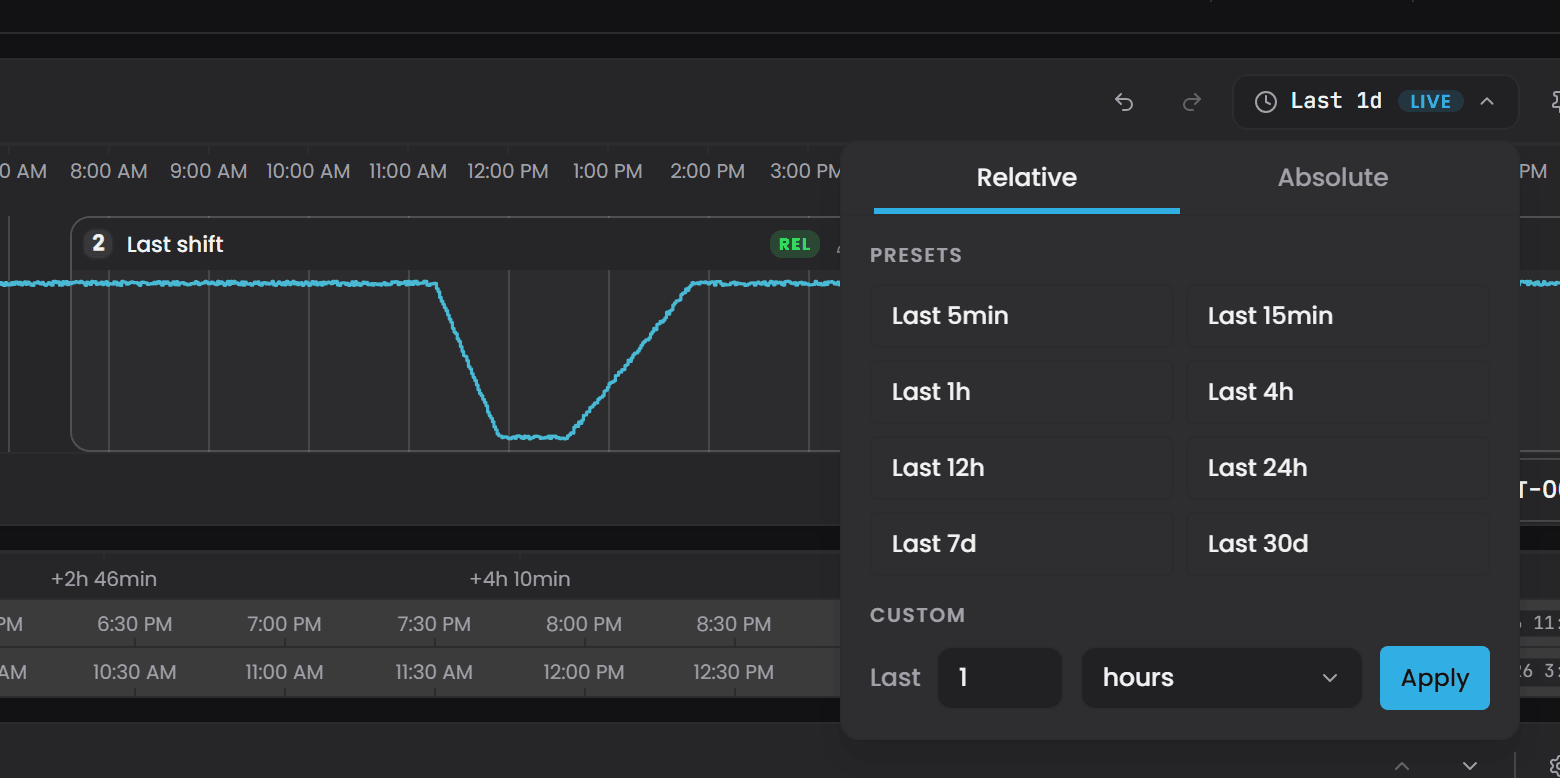
Zooming with a mouse or trackpad and panning by dragging are also supported. The x-axis above the band shows the full time period at a glance, with heavier gridlines at the top of the hour or at midnight. A green vertical line marked NOW indicates the current moment.
The Context band also hosts Frames. A Frame is a highlighted region that marks a time range you want to study more closely in the Bands. Each Frame carries its number in its top left corner, a REL badge when it is relative, and a pencil that opens its editor. The Context band supports up to three Frames, and many users choose two or three as a way to compare separate periods directly against one another.
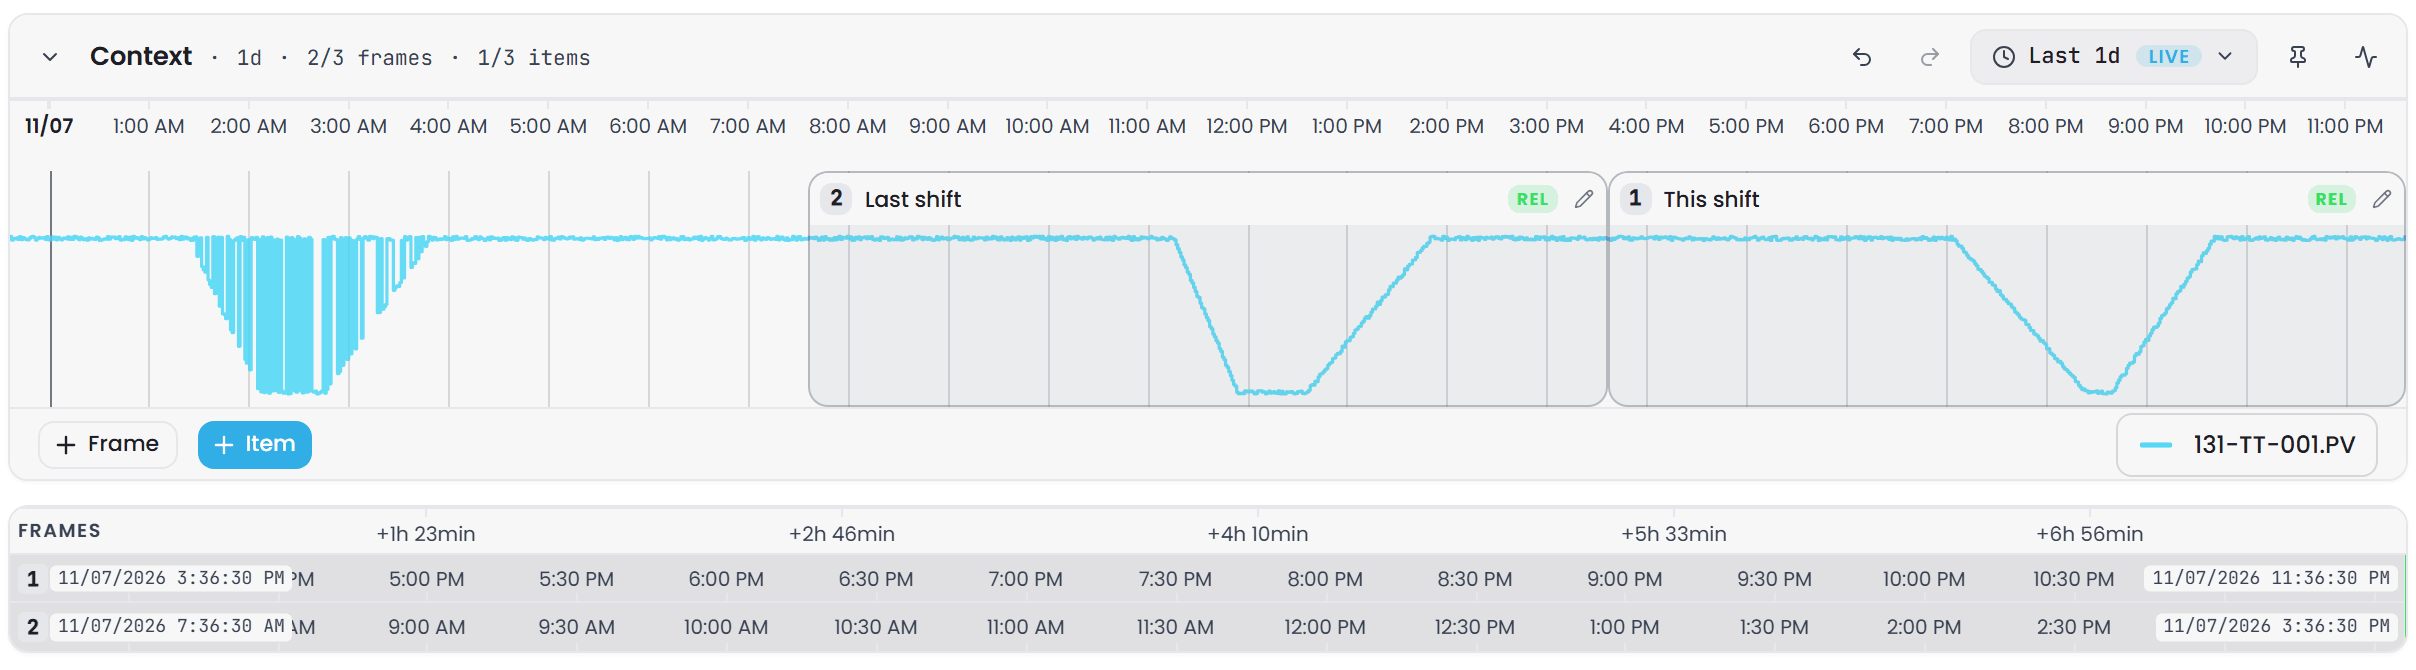
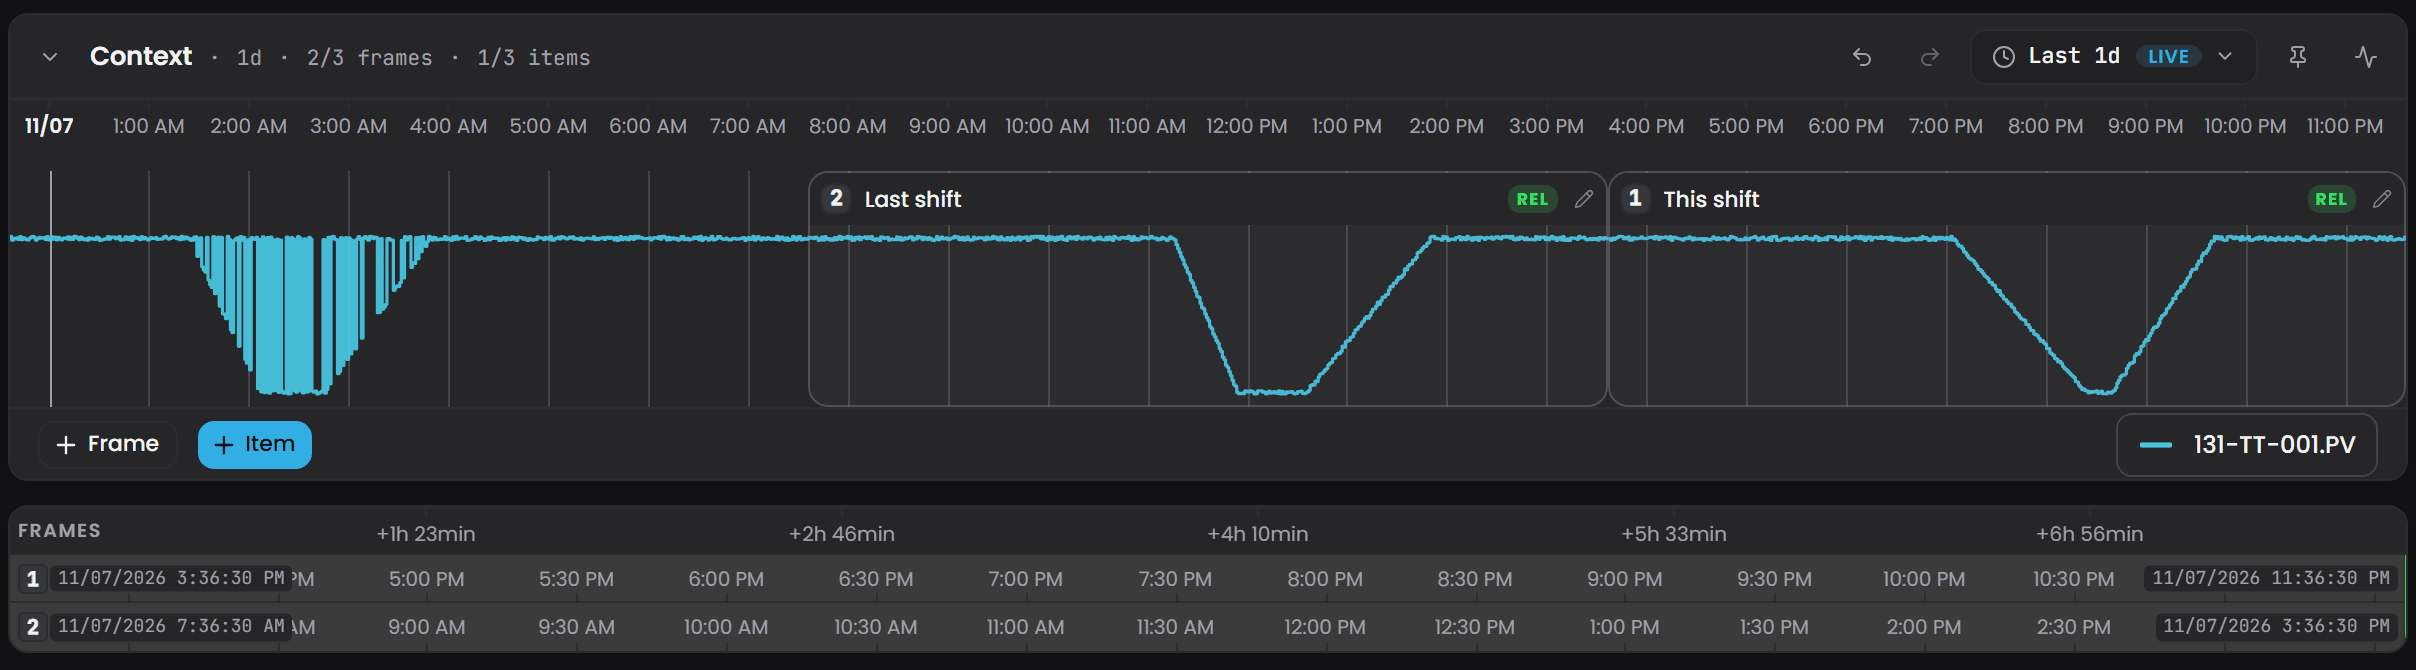
+ Item in the Context band plots up to three tags across the whole span, as a reference for placing frames. + Frame adds a frame.
The item picker#
Any time + Item is chosen, from the Context band or from a Band, the item picker opens beside the trend. For a Band it starts with Attach to frame, which decides which frame the new items are sampled within. Below that, a search box searches every source by name, and understands fields such as unit:bar or area:Boiler. The tree groups tags by source and dataset; tick the tags you want and choose Add N tags.
Filters opens a filter panel on the left, with the units, types, equipment and any other metadata fields found in the sources, and a Group by row that regroups the tree by those fields instead of by hierarchy. System and diagnostic tags are hidden by default; Show brings them in.
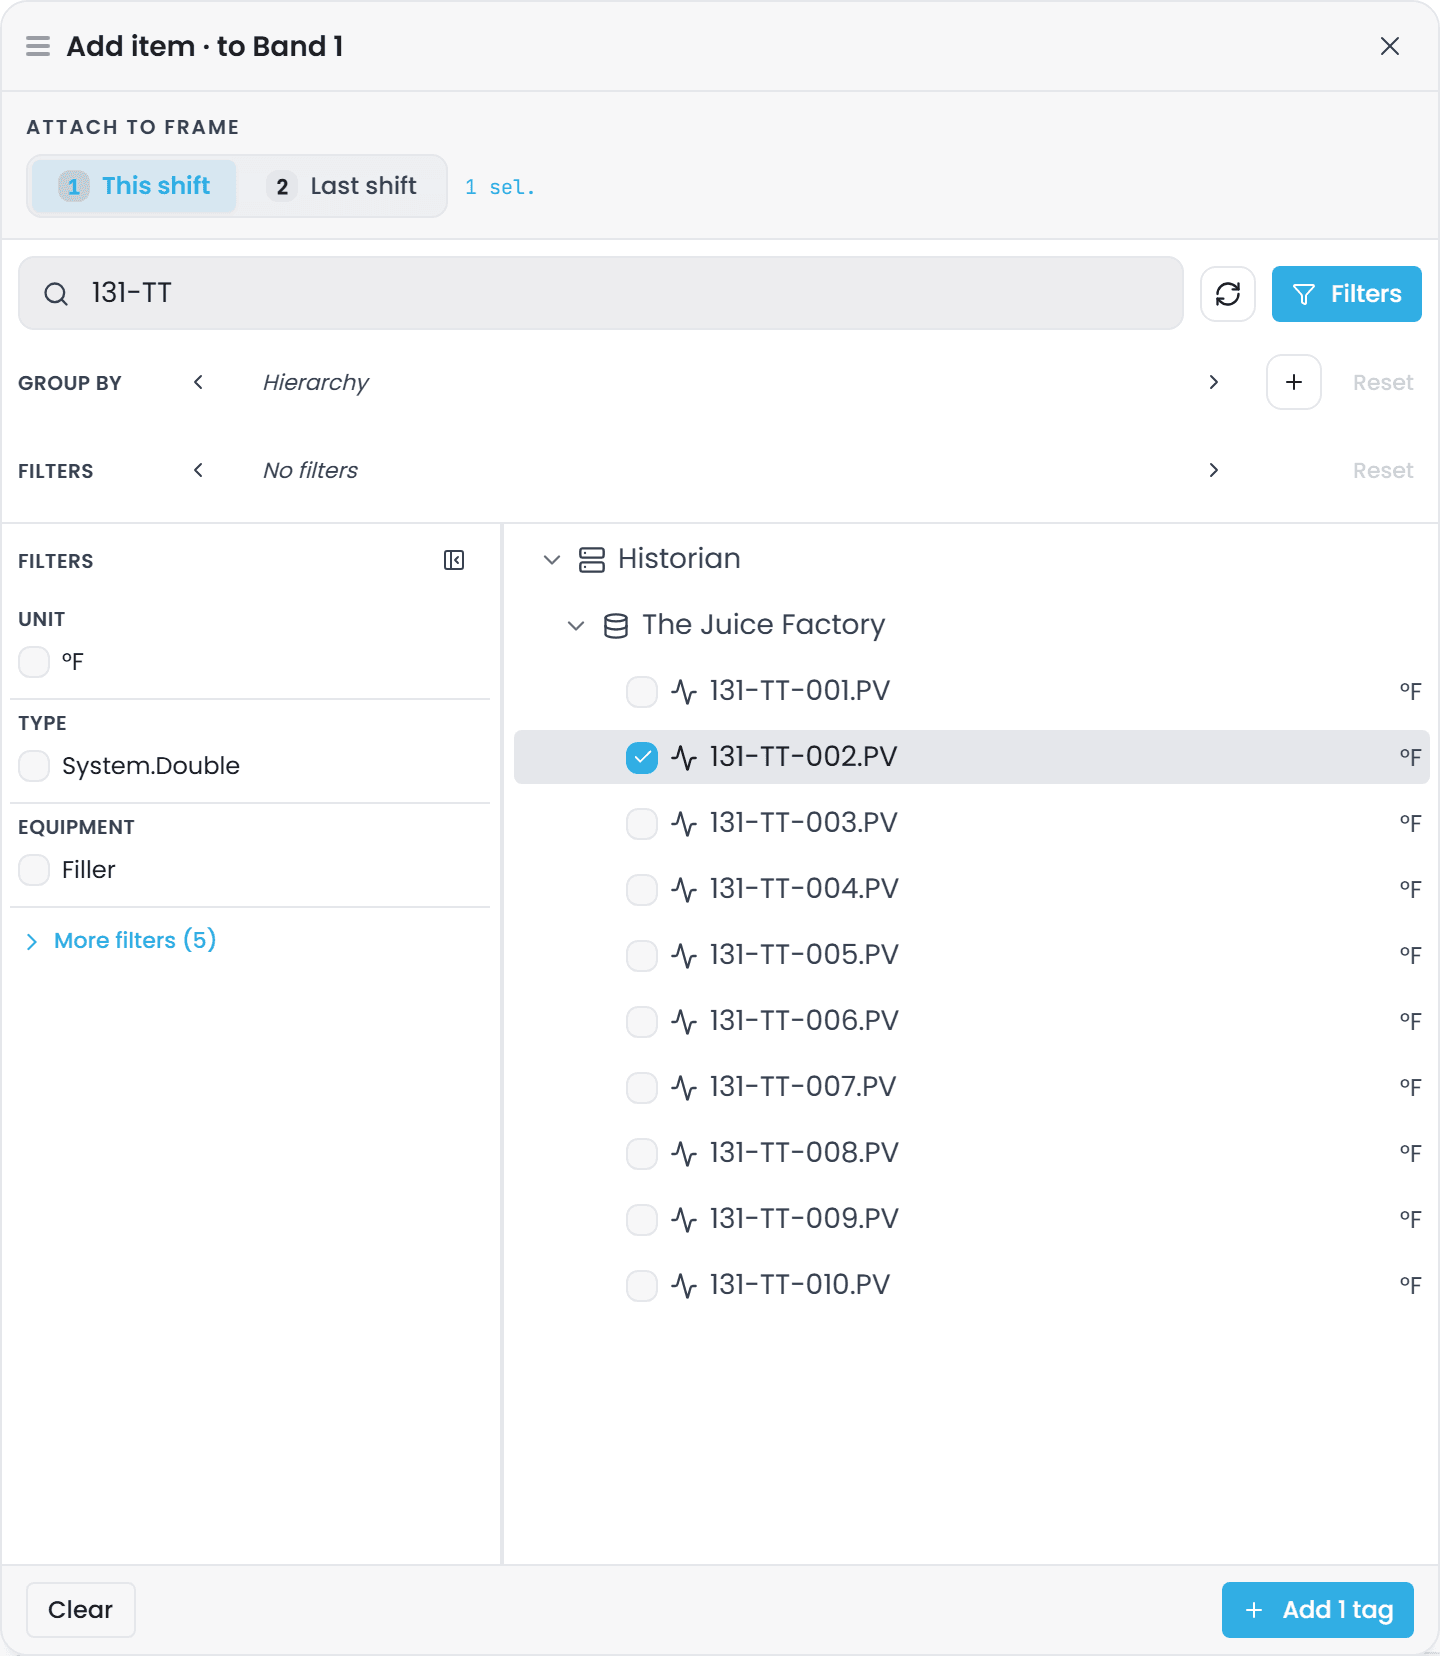
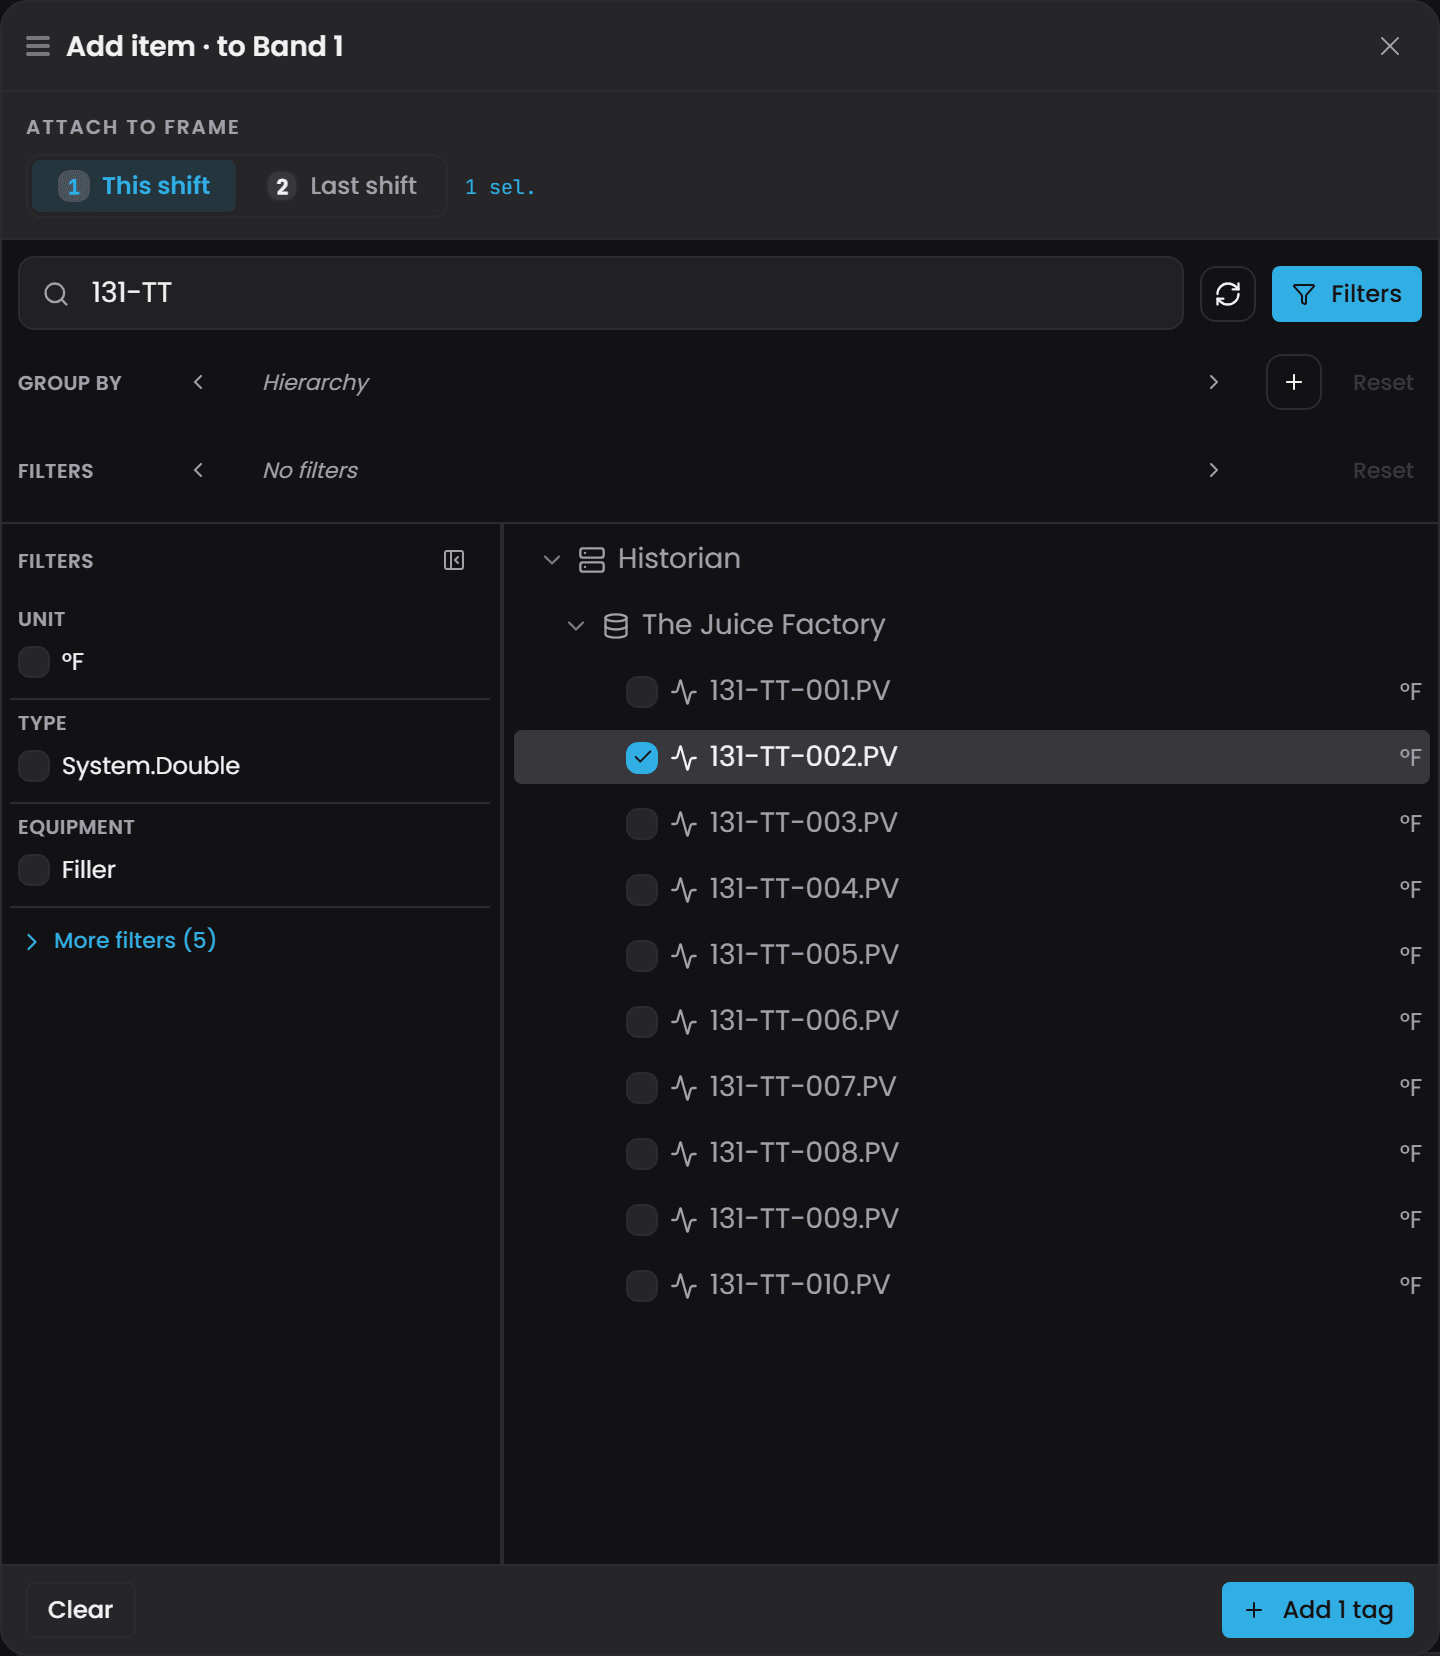
Video - The item picker. A link will be added here once the recording is published.
Working with Frames#
A Frame can be resized by dragging either edge. To move it, drag its numbered handle at the left of its row in the Frames ruler: a drop marker follows the mouse across the Context band and the Frame lands where you release. A click on the handle centres the Frame on that point instead. Clicking a Frame, or its pencil, opens its editor. The Identity tab holds the Frame's name and shows what it currently resolves to; the Time tab holds its time span; Delete at the foot removes it.
Frames can be absolute or relative in time. Absolute pins a start and an end on the clock and does not move even when live streaming is on. Relative anchors the Frame to NOW: a Window length and unit give its size, and Ends at NOW keeps its end on the current moment. Turn Ends at NOW off to place the window earlier, with Ends set to before NOW and an Offset from NOW in the unit of your choice; a Frame may also sit after NOW, as a forecast horizon to compare against. The editor shows the dates the Frame resolves to as you type.
For example, a Frame that always covers the most recent eight hours has a window of 8 hours that ends at NOW. The same eight hours one shift earlier is a window of 8 hours that ends 8 hours before NOW. With live streaming on, relative Frames advance with real time.
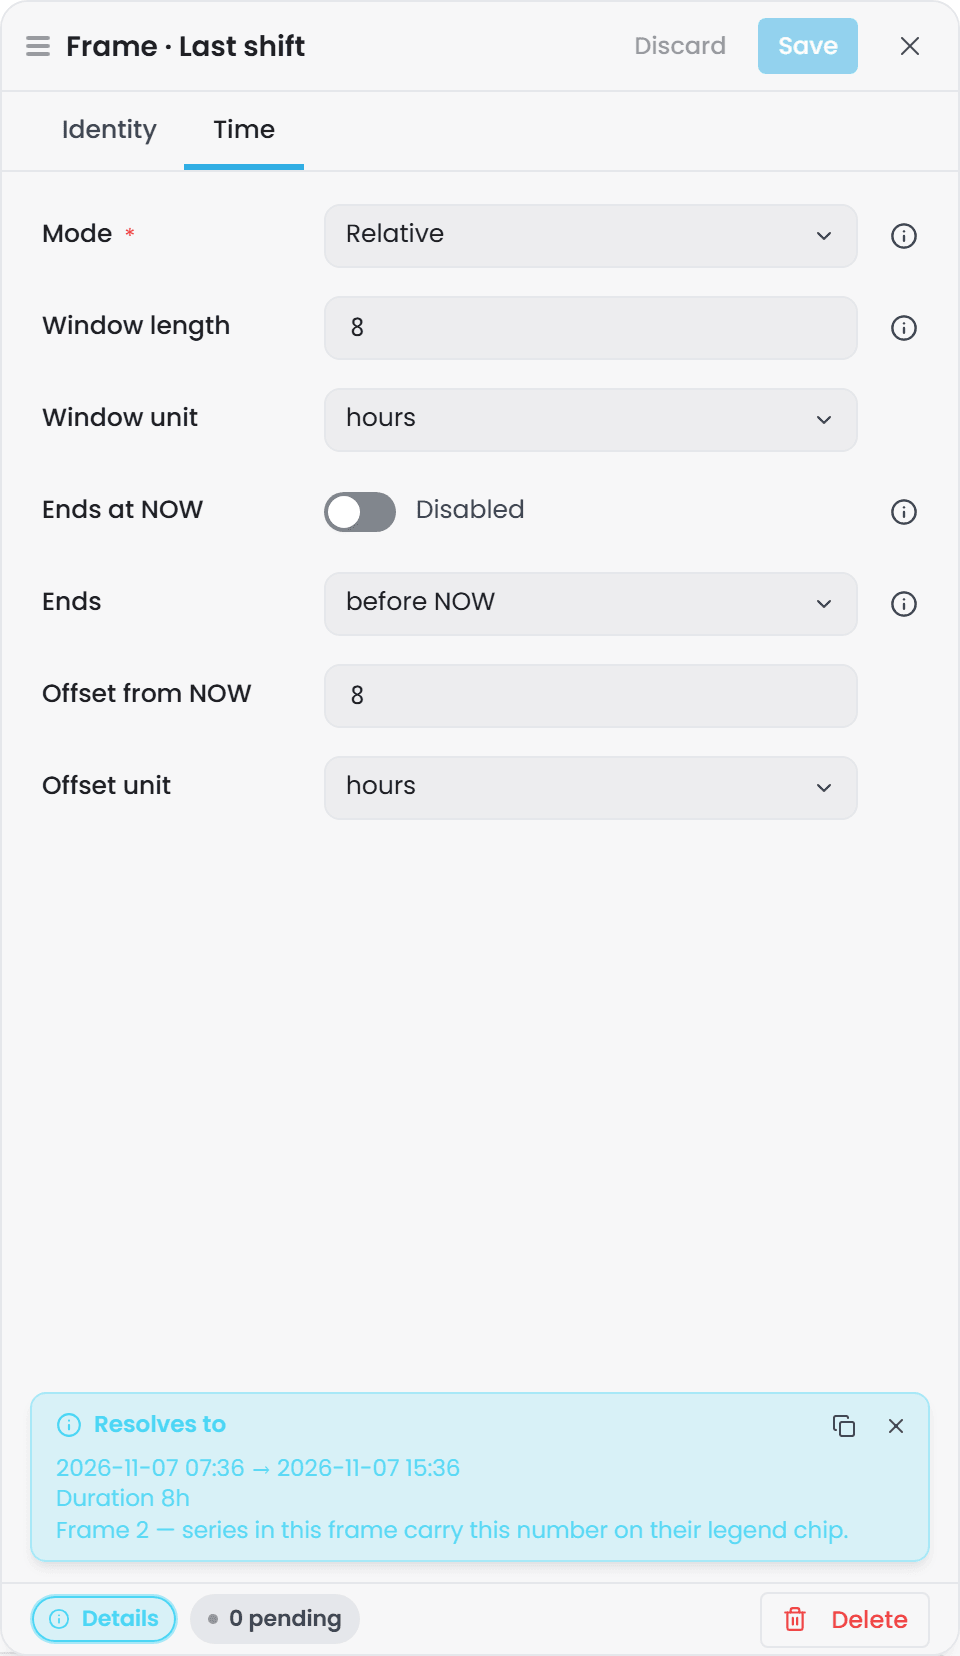
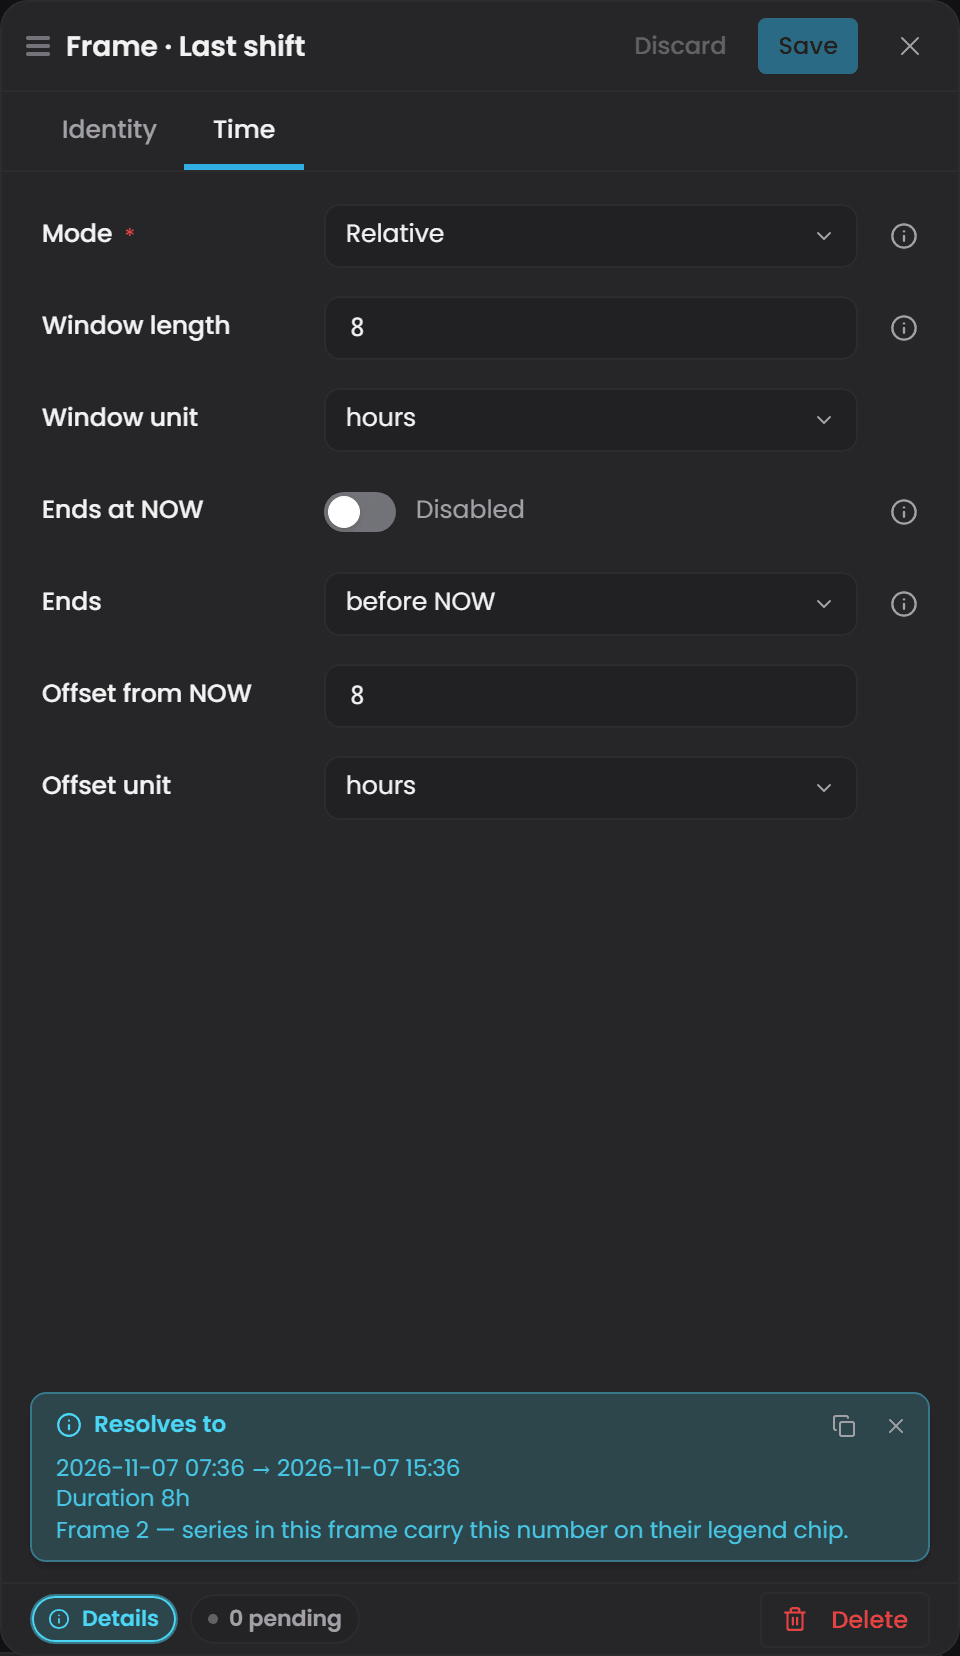
The Frames ruler is displayed below the Context band, one row per Frame, with the Frame's start and end at either end and a frame-relative axis above. Clicking a Frame's number recentres the Context band on it. When more than one Frame exists, the Frame with the longest duration defines the time window displayed across the Bands.
Bands#
Bands occupy the lower portion of the screen and provide the detailed view. Their time span is determined by the longest Frame, and the start of every Frame is aligned to the left edge, which makes period-over-period comparison clear without any manual adjustment.
Each Band has a header with its name and item count, arrows to move it up or down among the bands, Band properties and Maximise. The properties have an Identity tab for the name and a Y-axis tab with the scale, a manual Min and Max, Pin to zero and Show gridlines; Delete at the foot removes the band. Bands stay independent of one another, so different groups of signals can have different scales. + Add band under the last band adds another.
Items are added to a Band with its + Item button. An item is a single tag plotted in the band, sampled within one Frame; a Band holds up to twenty. A tag can appear more than once, once per Frame, which is how the two shifts in the picture above are compared.
The legend under the chart shows one chip per item, with its colour, name and Frame number. The two lines of figures beneath a chip are the item's value at the start and end of its Frame on the left, and its latest value and the value under the cursor on the right; the latest value turns green when the Frame ends at NOW and the value is live. Clicking a chip opens the item's properties.
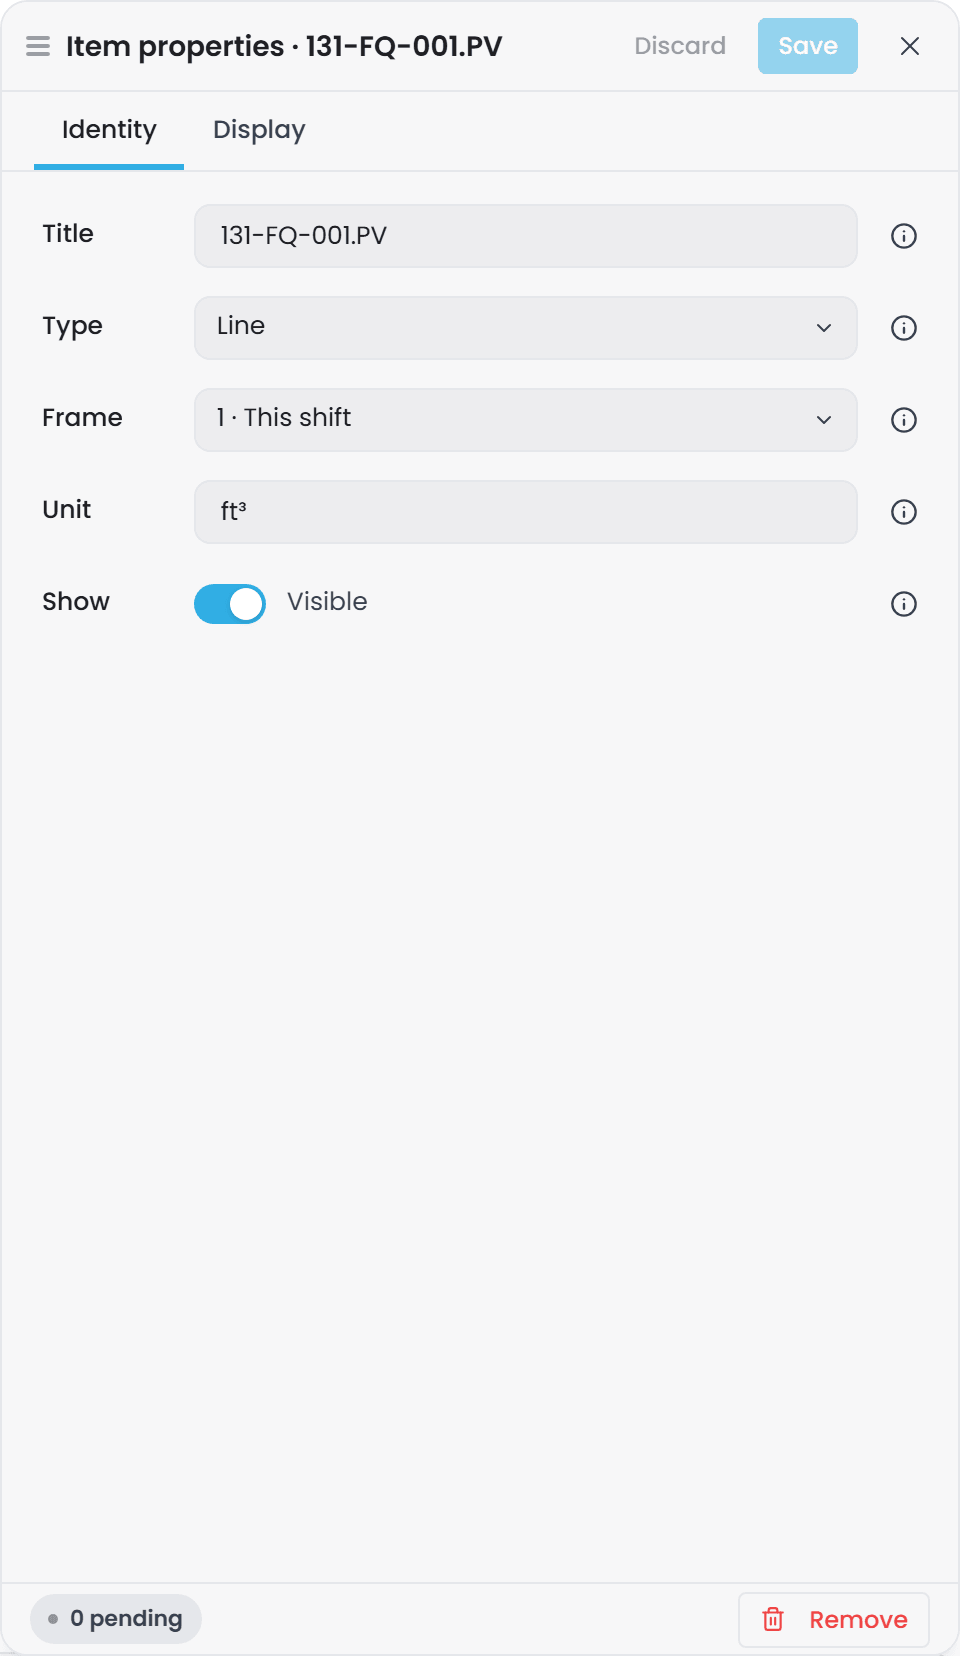
Item properties have two tabs. Identity holds the Title, the Type (Line, Area or State), the Frame the item is sampled within, its Unit, and a Show switch that keeps a hidden item in the legend without retrieving or drawing it. Display holds the colour, line thickness, opacity and stroke style. Remove at the foot takes the item out of the band.
The State type is for tags whose value is a mode rather than a magnitude. Instead of a stair-step line, it displays blocks of time that change colour and label whenever the tag changes state. A tag the source reports as an enumeration is drawn as State from the moment it is added.
Data Table View#
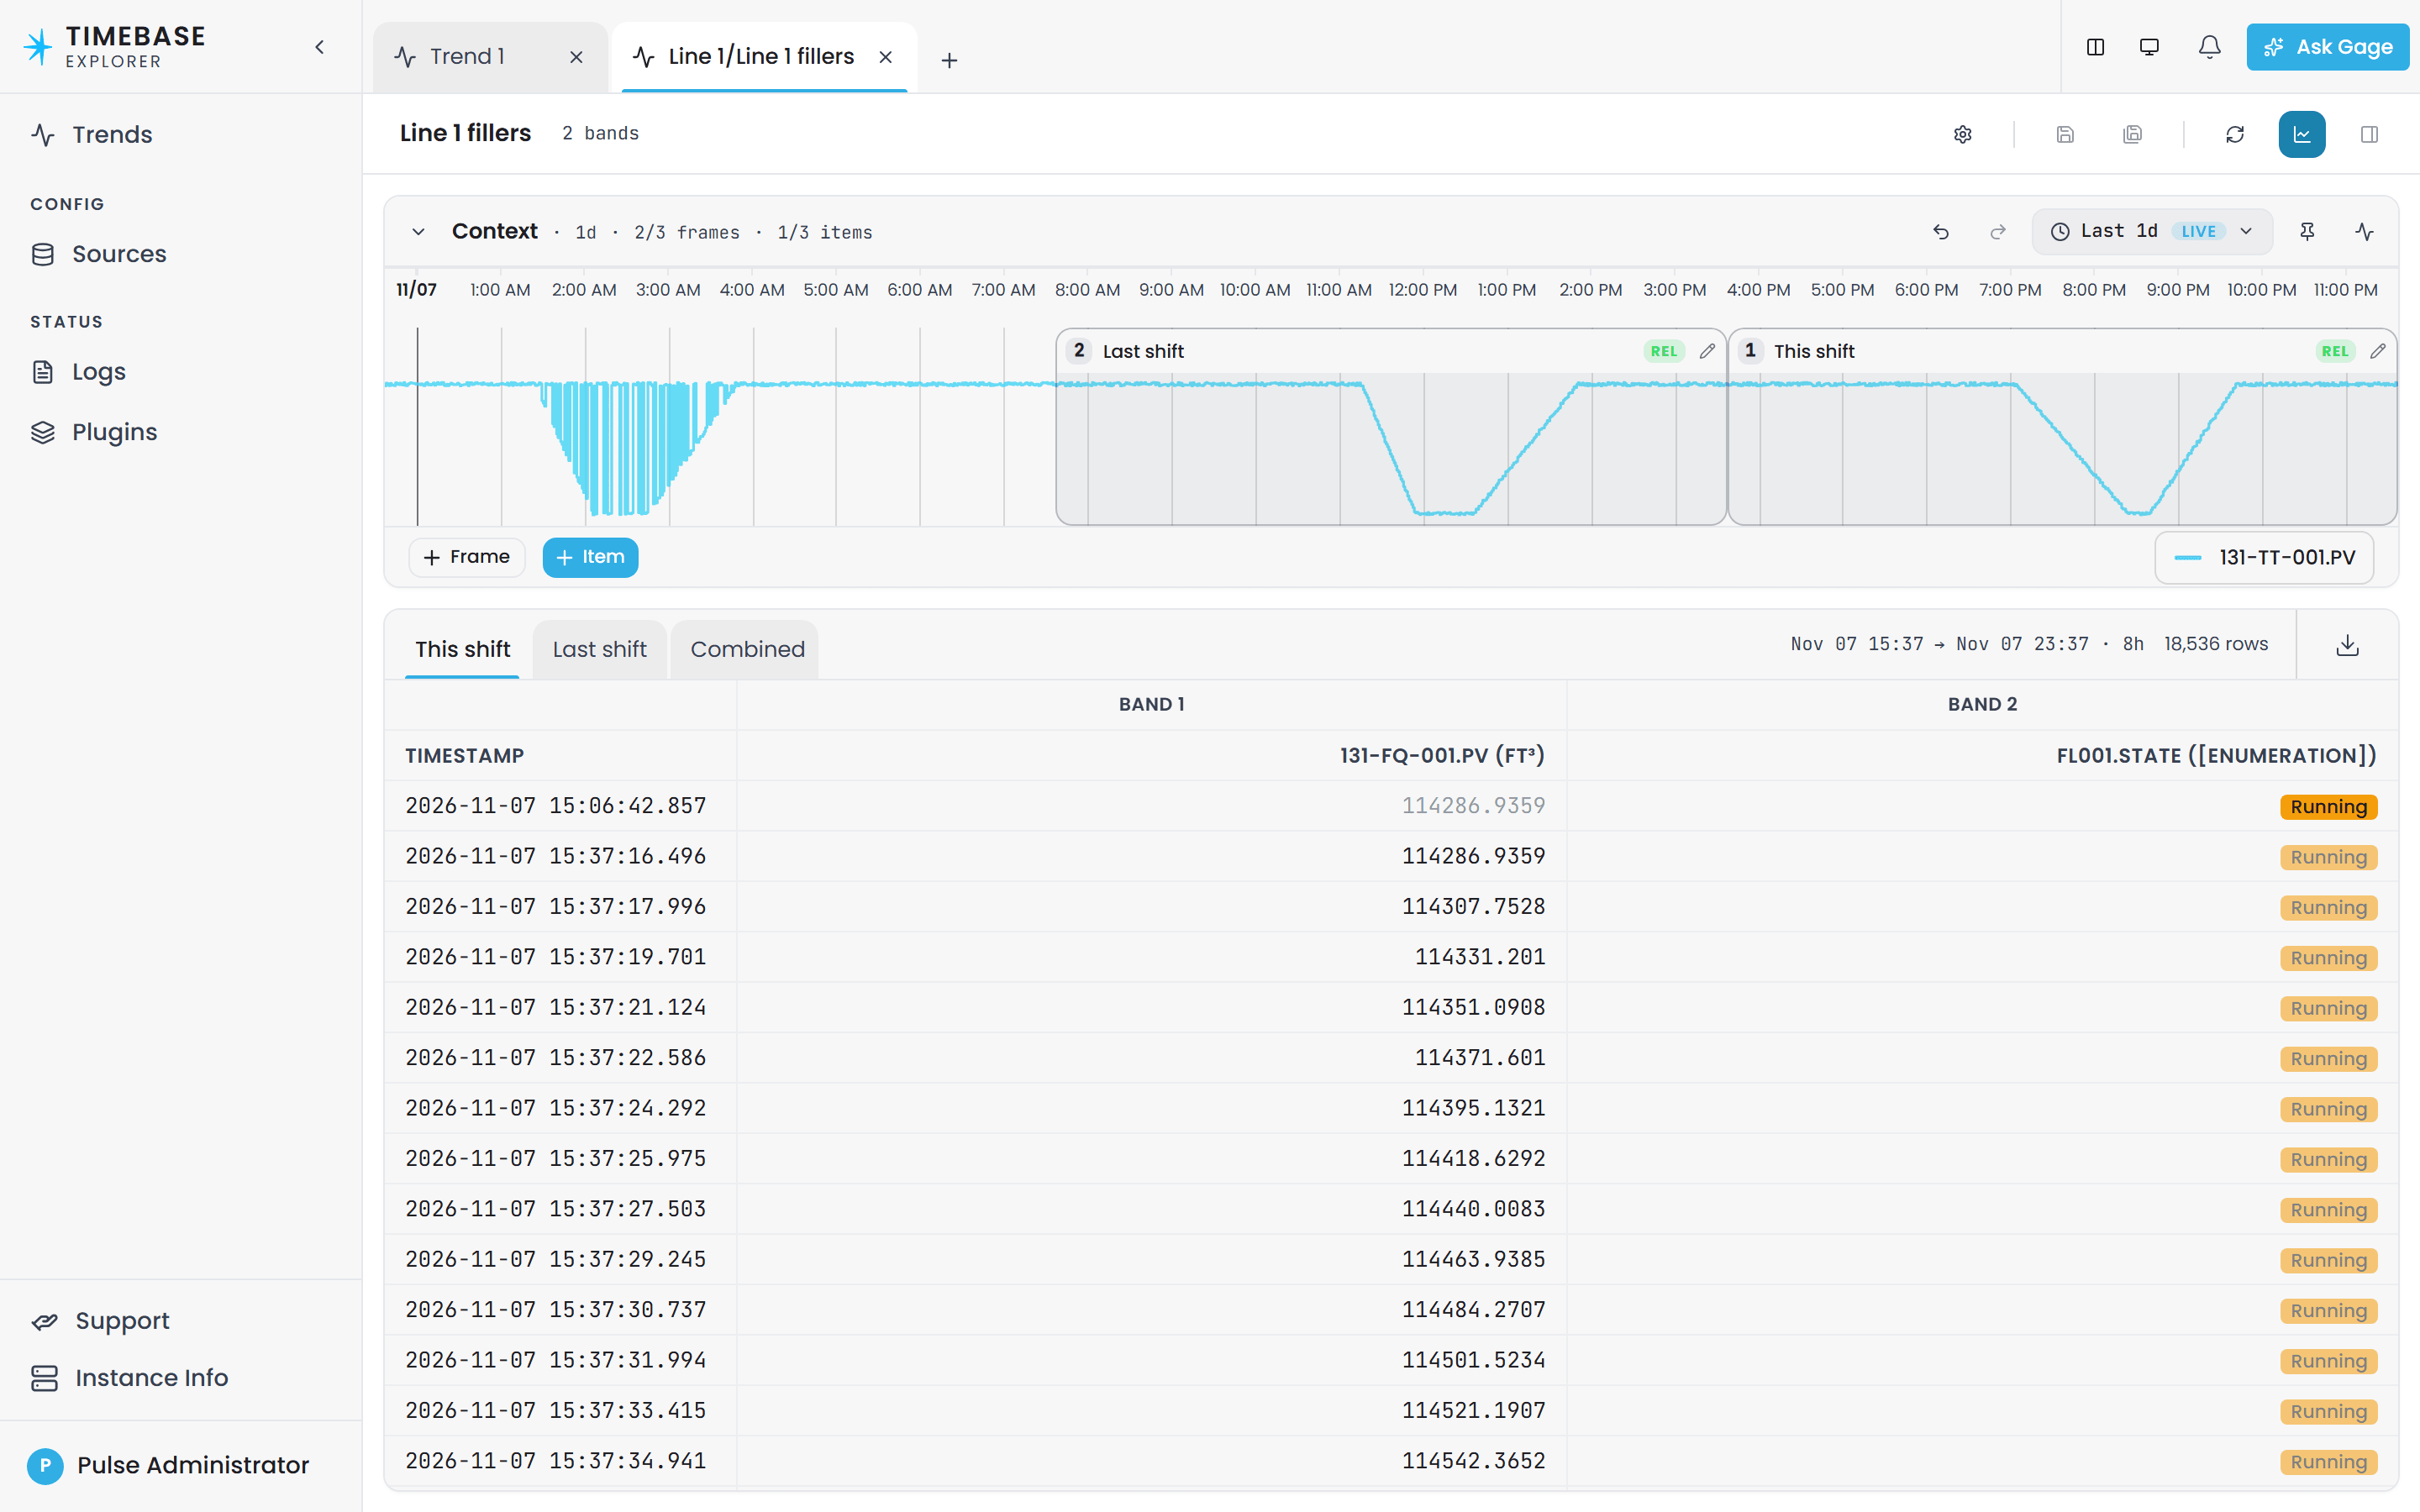
Show table in the trend header switches Explorer from the charts to a table of raw data, with one tab per Frame and a Combined tab. The table groups every item from every Band into a single wide format under a Band heading each. Every unique timestamp becomes a row. When a tag has no recorded value at that timestamp, the previous value is carried forward and shown in grey. This creates a true point-in-time view that is ideal for data comparison, export, or offline analytics. The header shows the Frame's range and row count, and the download button exports the tab as a CSV file.
Aggregates#
Show value rail opens a panel beside the bands that lists every item with its time-weighted average, minimum and maximum over its Frame, and the Frames' resolved ranges above. It has its own CSV export.
Glossary#
Context band: The high-level timeline across the upper portion of a trend. It sets the span, hosts the Frames, and can plot up to three reference tags.
Frame: The shaded block inside the Context band that selects a time period for detailed review. Frames can be absolute or relative, and carry a number that their items show in the legend.
Item: A single plotted instance of a tag inside a Band, sampled within one Frame. A tag may appear as several items, one per Frame.
Live streaming: The mode, switched with the pulse icon beside the time range, that keeps the trend aligned with the current time while preserving the relative time relationship defined in the Frames.
Point-in-time normalization: The method used in the Data Table view to align timestamps across tags by carrying previous values forward so every row contains a complete set of values.
Band: The detailed plotting area in the lower half of a trend where tags are analyzed. Items are plotted here, and Bands can be renamed, scaled and reordered.