Tag Data View
Open any tag from the Historian's Tags list to see its recorded values as a table and a trend: the relative and fixed time windows, Live tailing, the quality colours, and copying rows to a spreadsheet.
Overview#
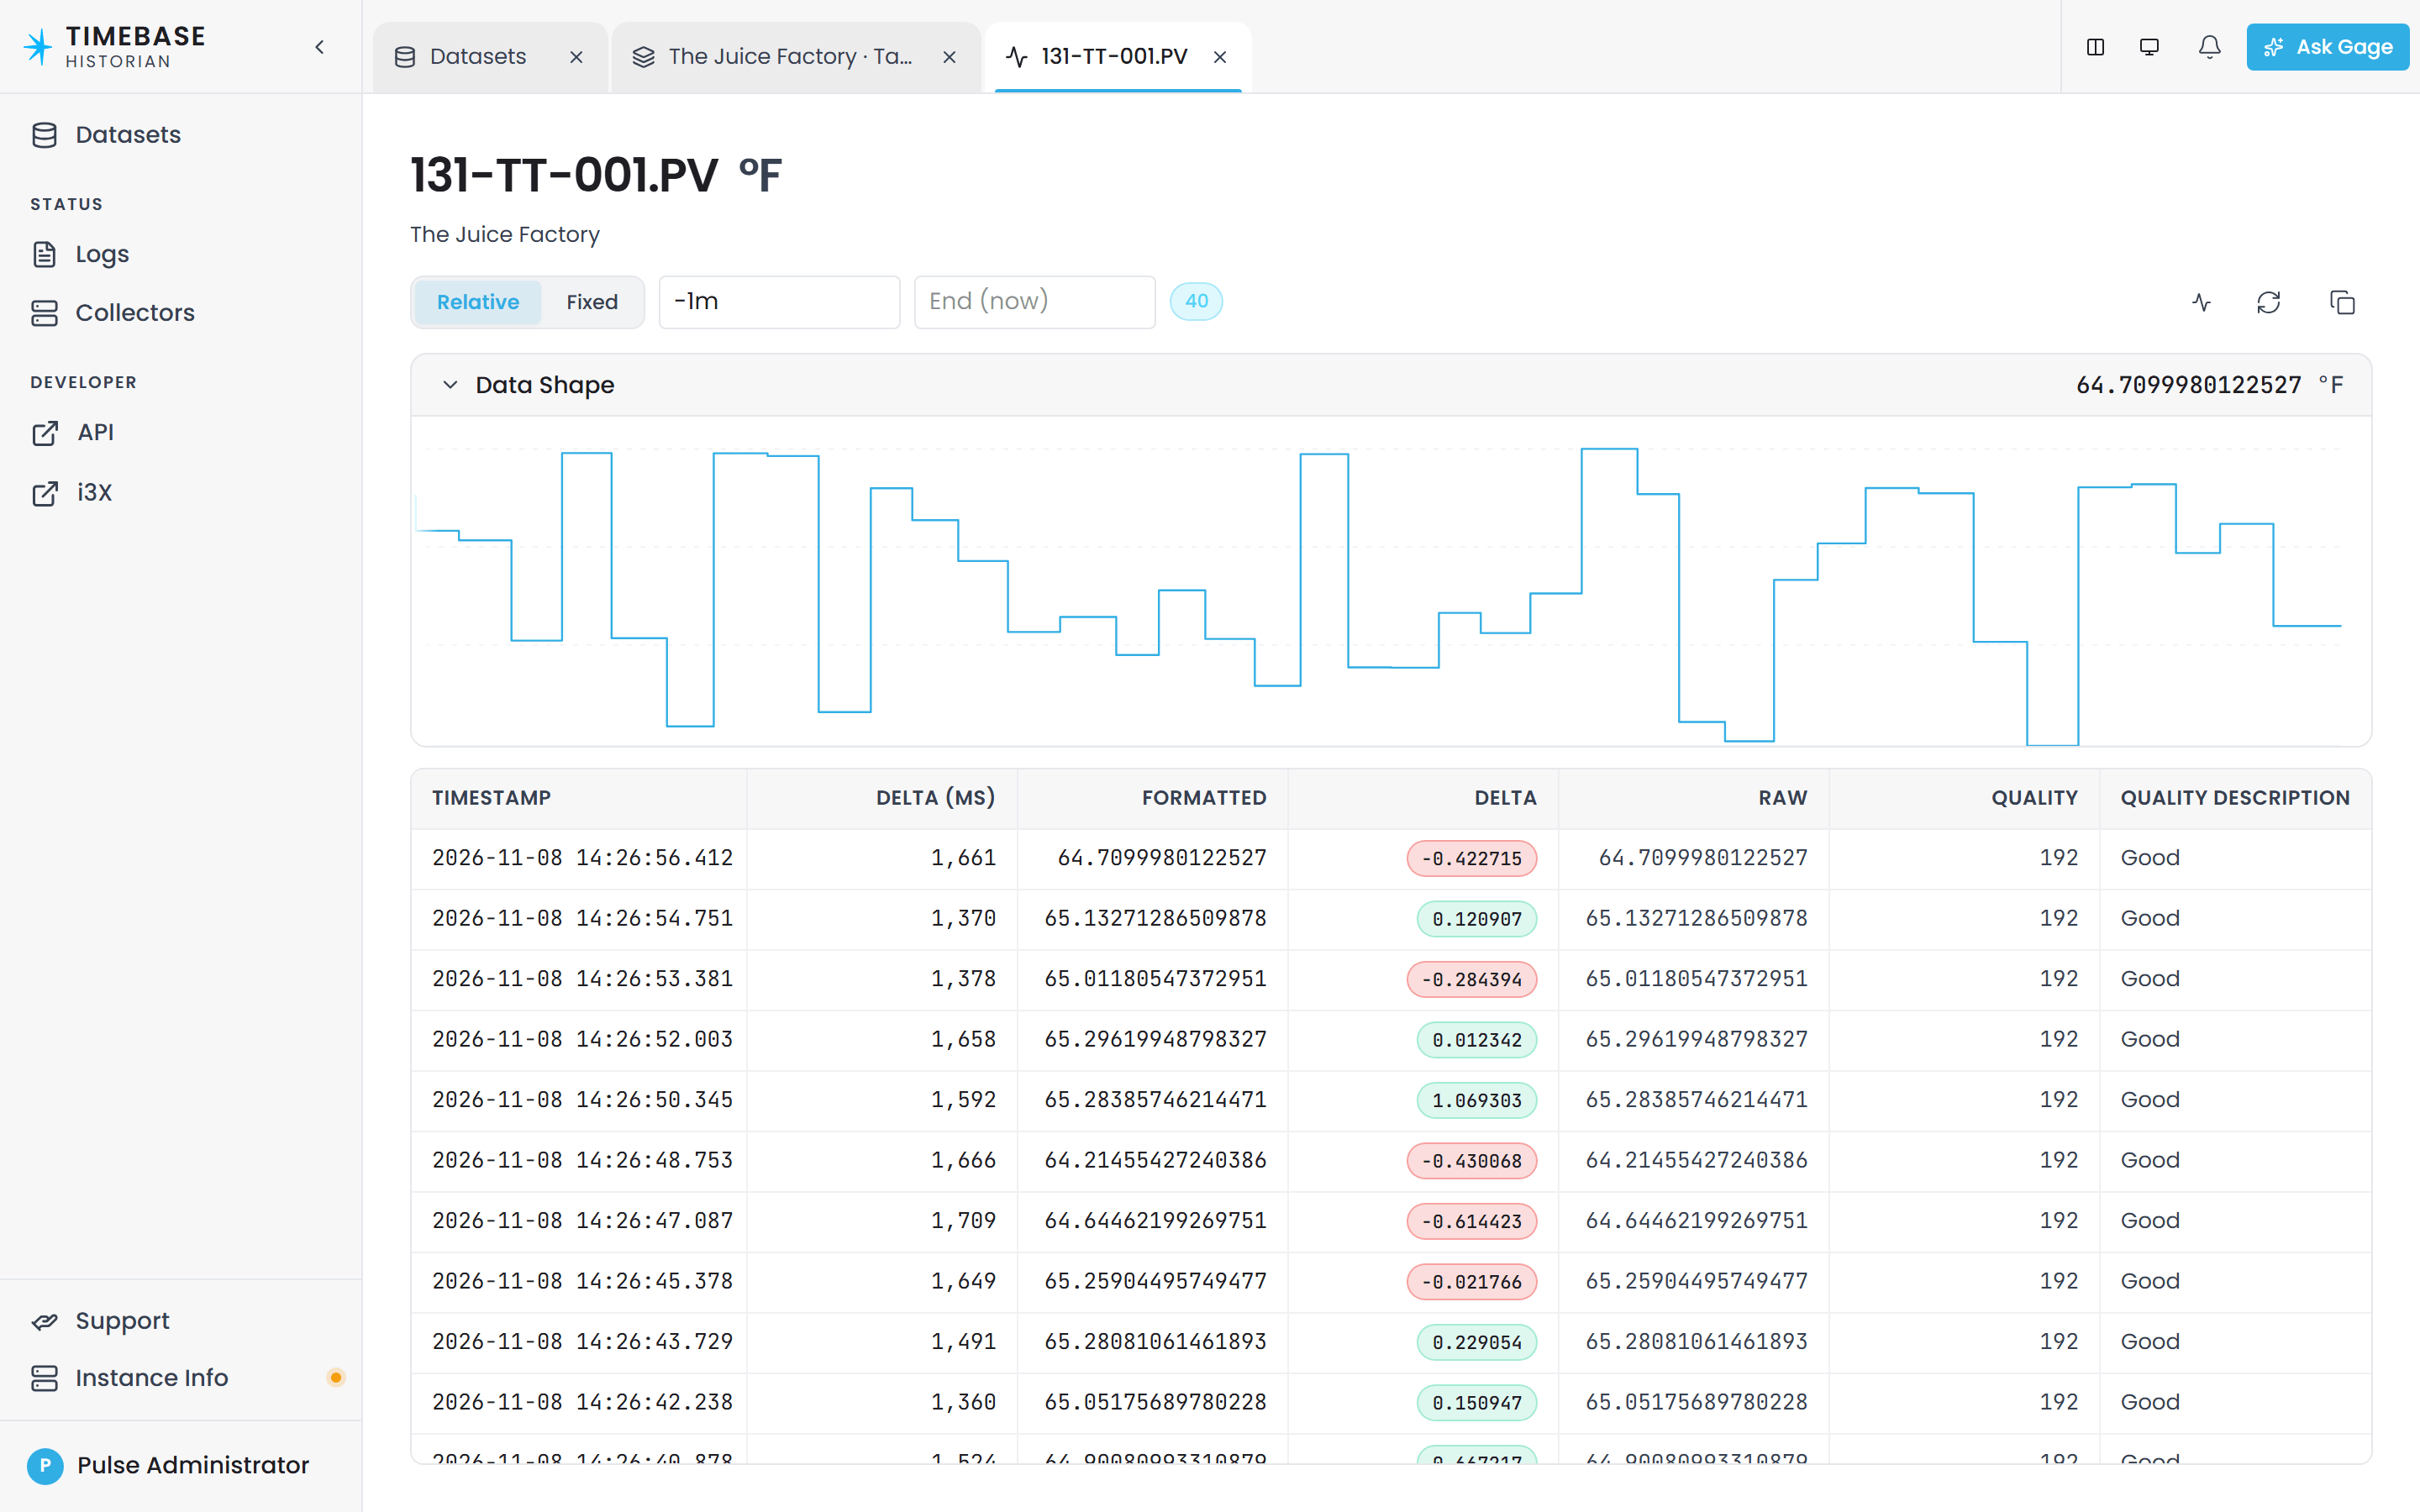
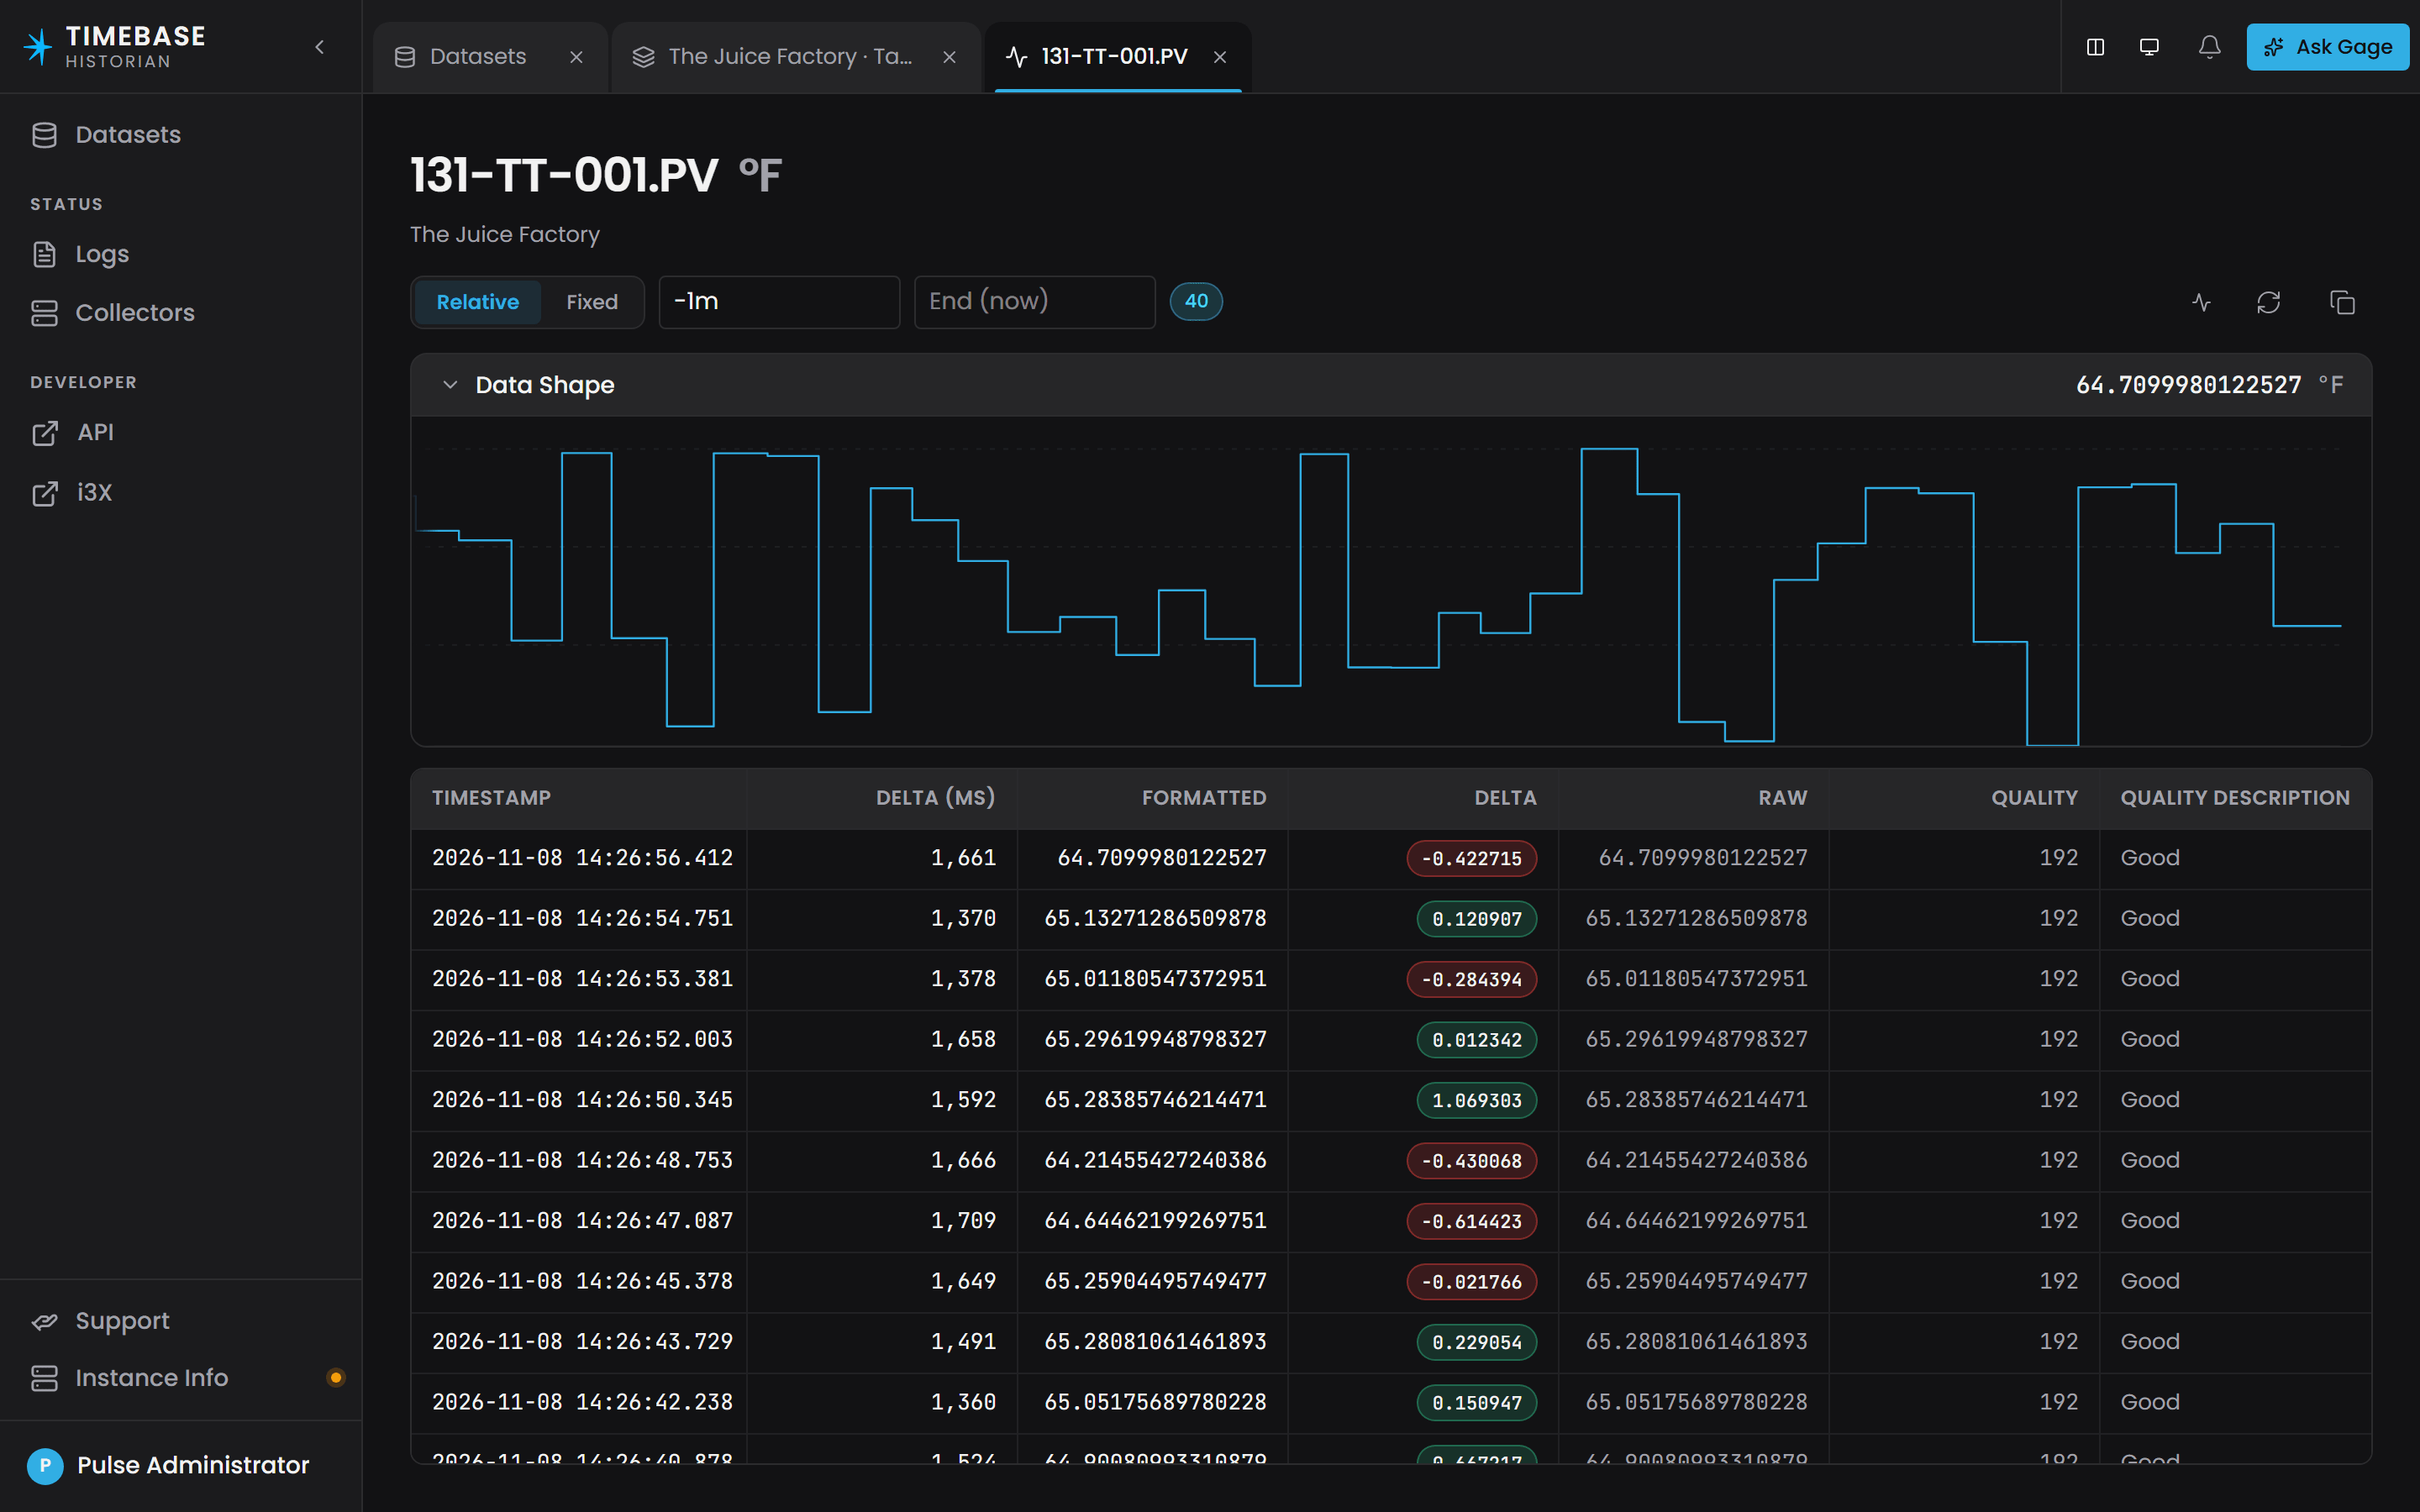
Select any tag in a dataset's Tags list and the Historian opens that tag's data in a tab of its own: a trend of the values over the chosen window and, below it, a table of every recorded sample as time, value and quality. You can set the window as an offset from now or as fixed dates, follow new values live, and copy the rows to the clipboard for a spreadsheet.
Use it to confirm that data is arriving, to inspect quality codes, and to spot-check values without writing a query.
Opening the view#
- Open
https://<your historian>:4512and sign in. - Choose Datasets, select a dataset, and find the tag in its Tags list; filter by name if the list is long.
- Select the tag's row. Its data tab opens showing the last minute of recorded values, newest first.
The tab keeps its time window when you switch to another tab and back. It always comes back with Live switched off.
Setting the time window#
A control in the tab's header switches between Relative and Fixed.
Relative is the default. Enter the start and end as offsets from now:
| Expression | Meaning |
|---|---|
-1m |
One minute ago (the default start) |
-5m, -2h, -1d |
Five minutes, two hours, one day ago |
-30s |
Thirty seconds ago |
| empty | Now (the default end) |
h, d, w, M, y |
The start of the current hour, day, week, month or year |
d-1d |
The start of yesterday |
d+8h |
Eight o'clock this morning |
An anchor letter can be followed by one offset, with the units s, m, h, d, M and y; w is an anchor only, so write seven days as -7d. An expression the Historian cannot read is marked in its box and the window does not change.
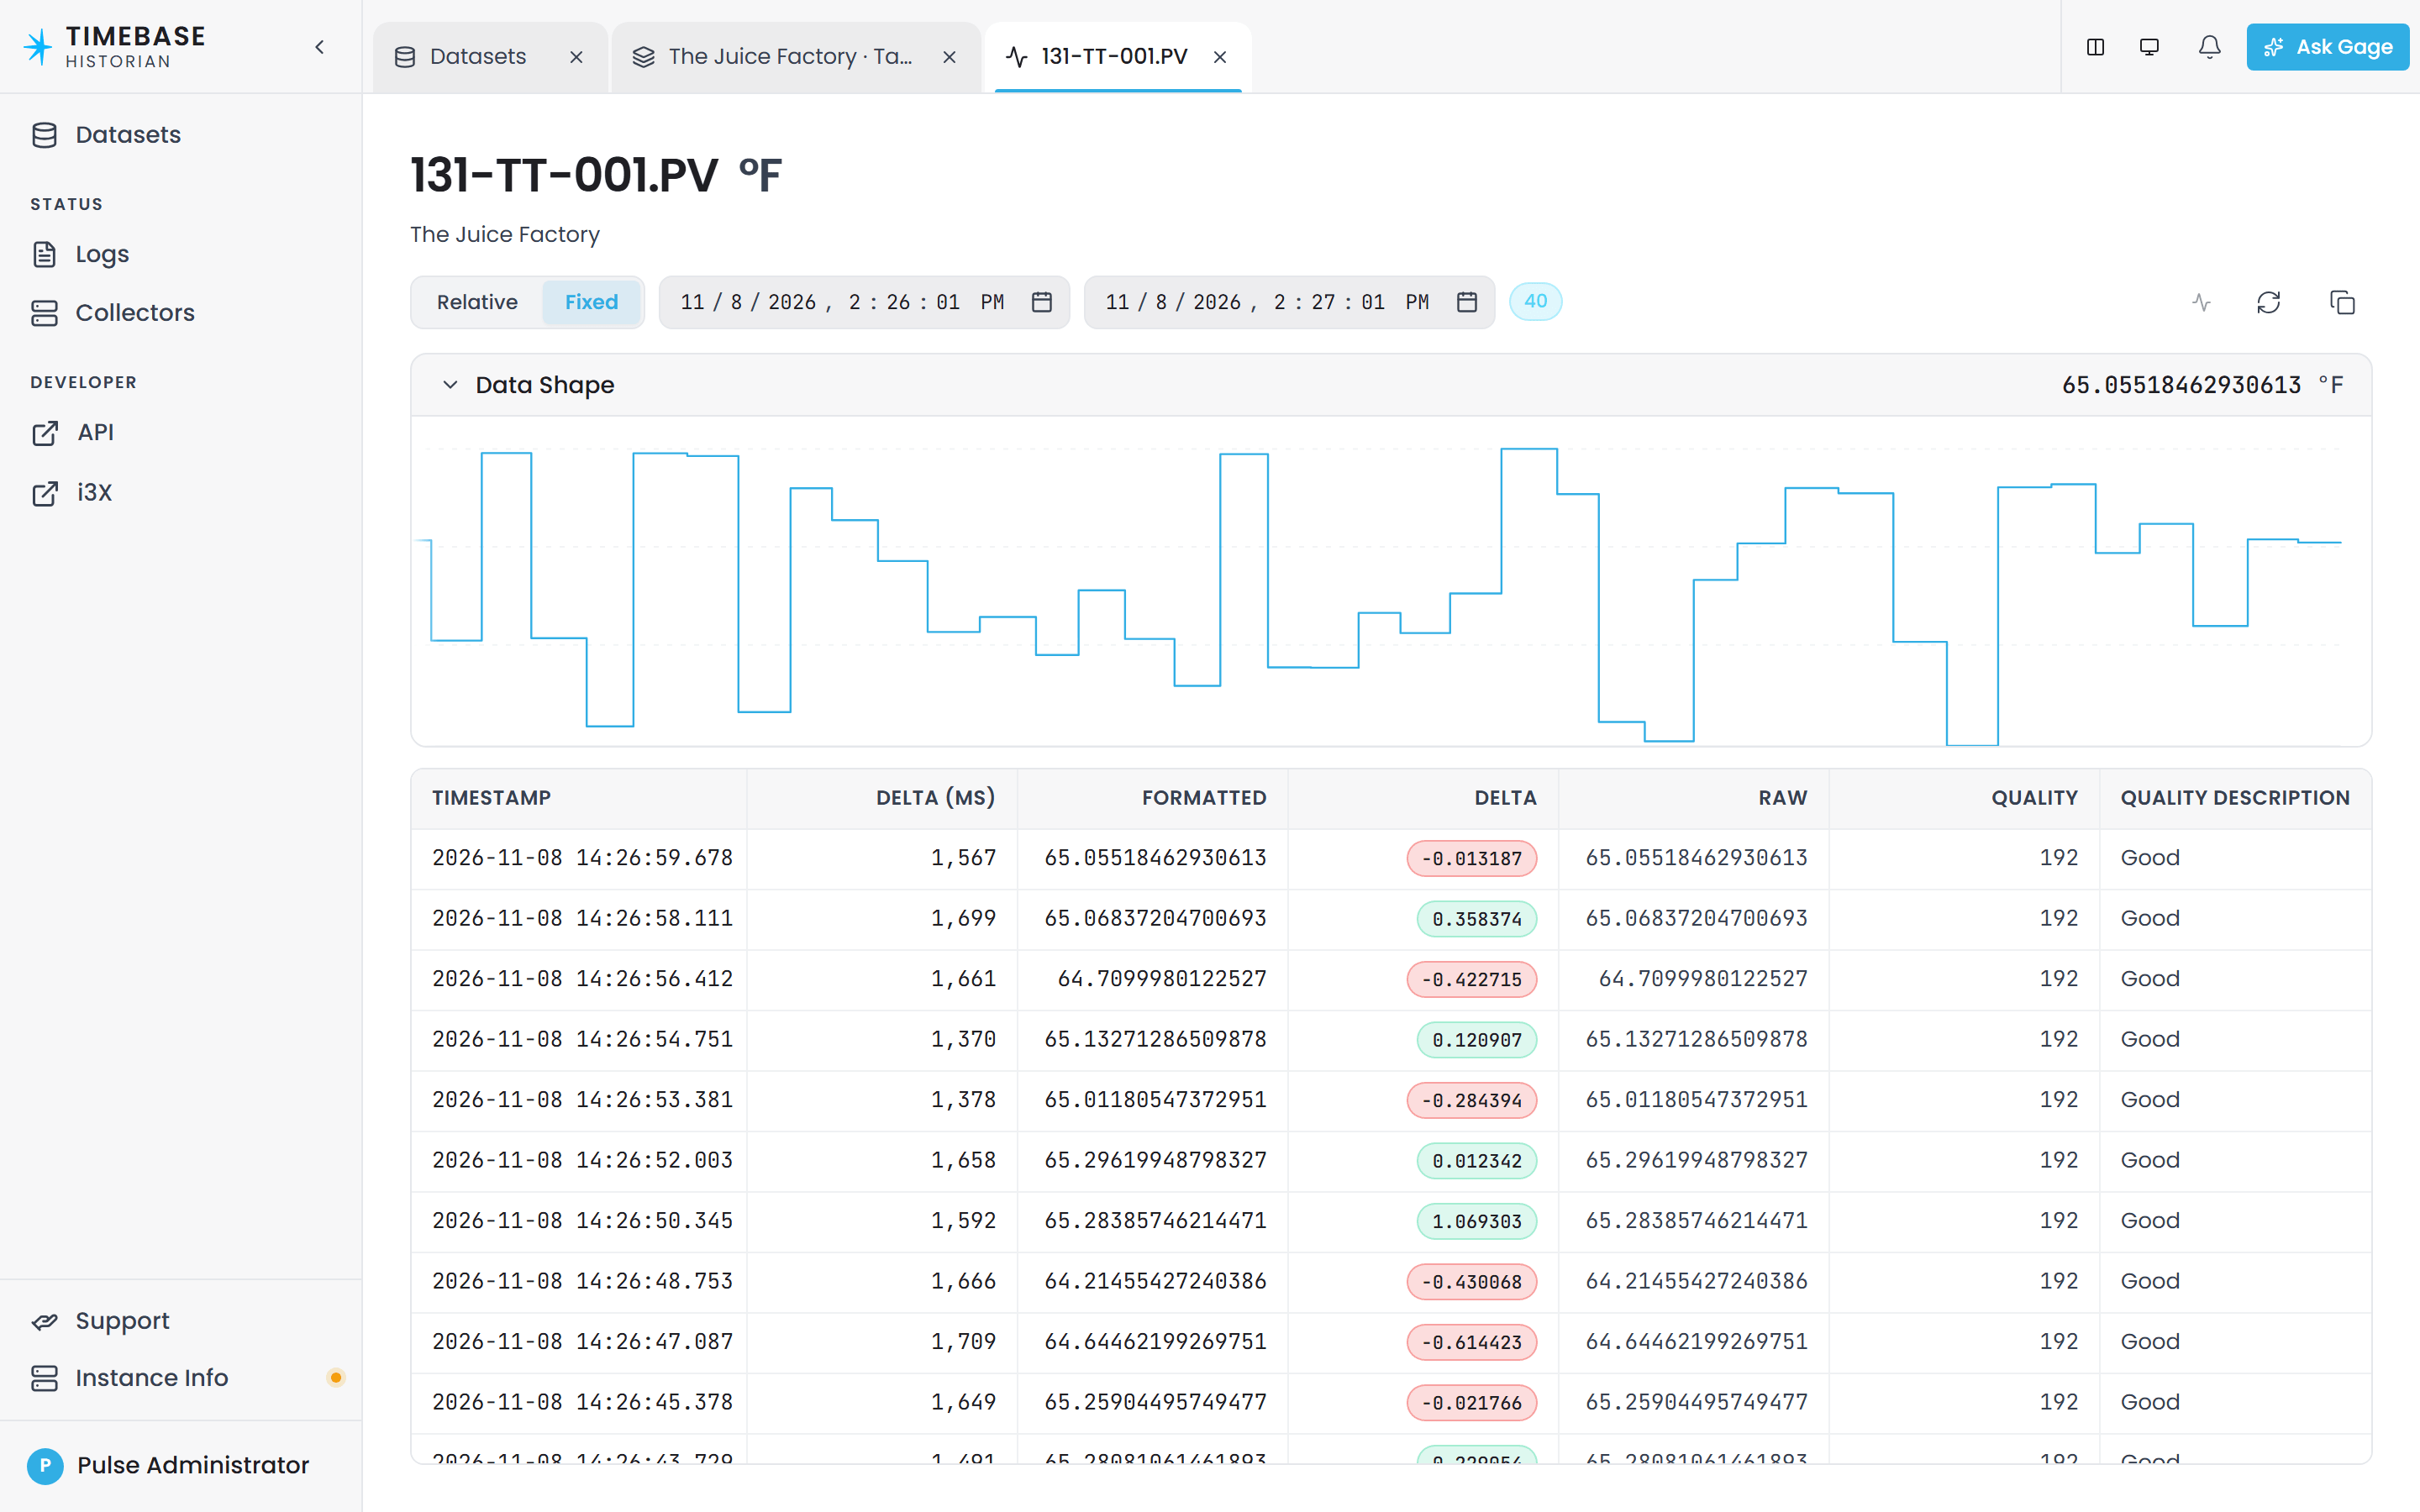
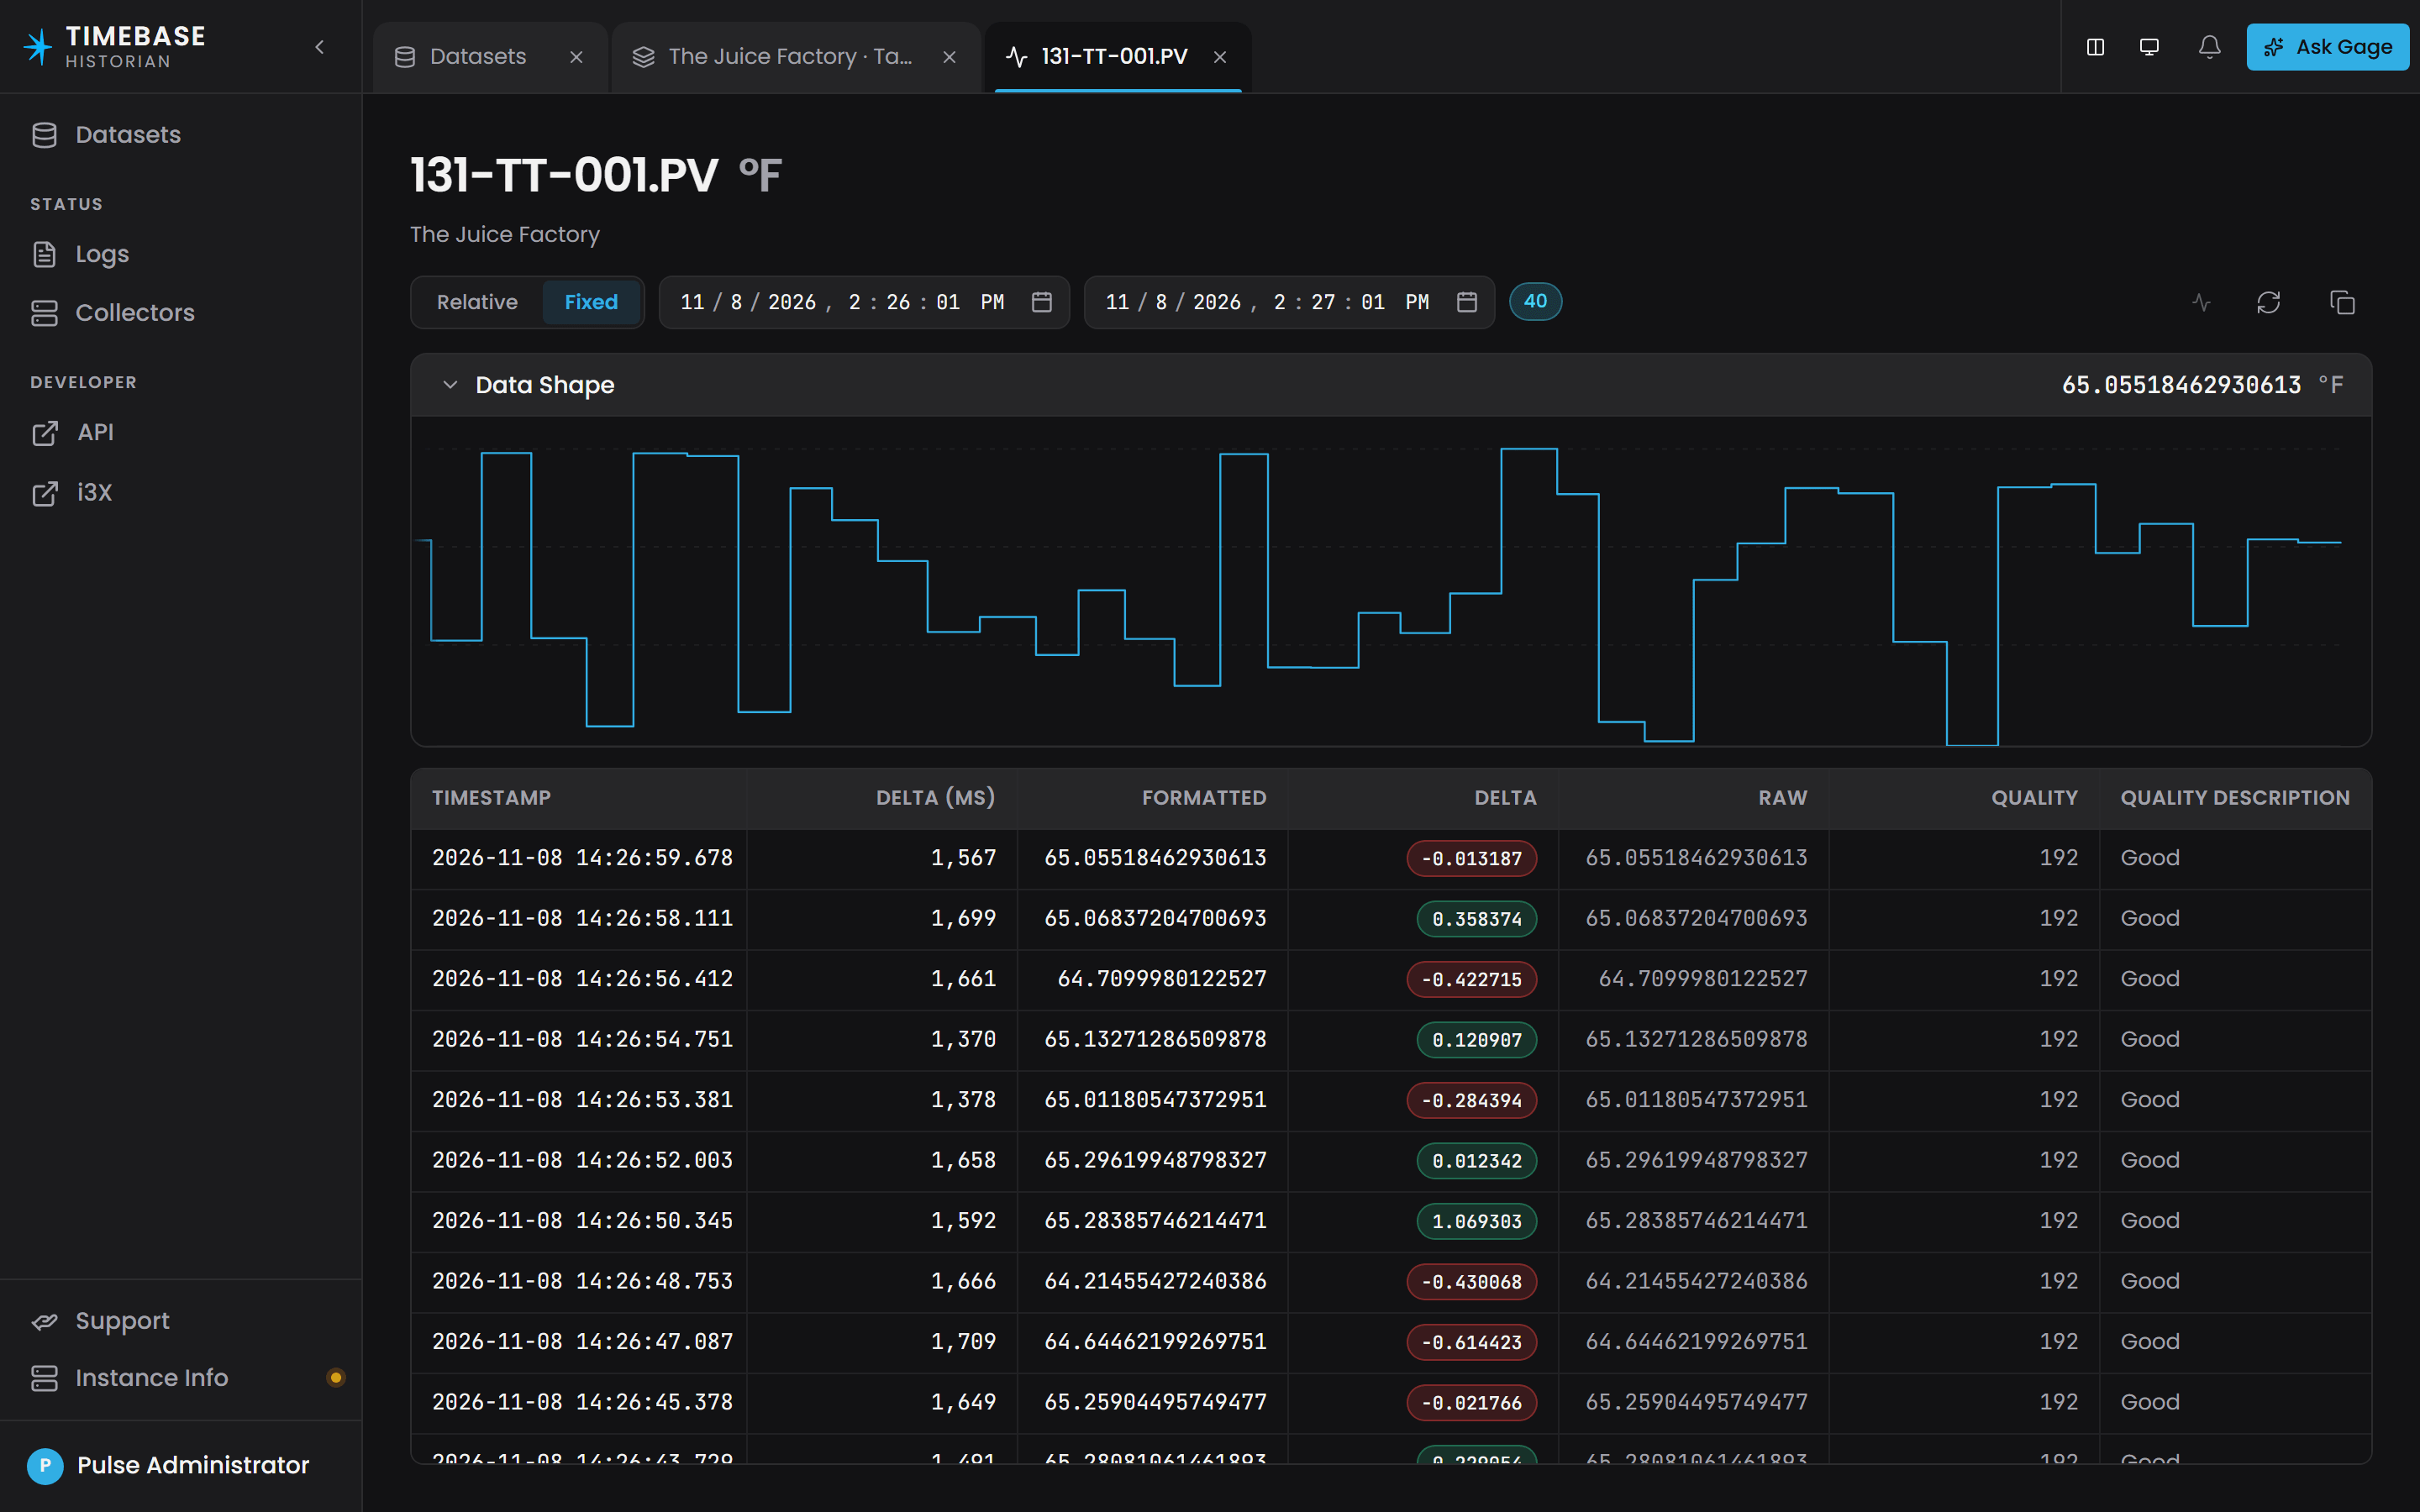
Fixed takes exact start and end dates and times from date pickers. Switching from Relative to Fixed fills the pickers with the times your relative expressions resolve to at that moment, so you can pin a window you were looking at.
Live#
Live, Refresh and Copy to clipboard are the three icons at the right of the header. Live follows the tag as new values arrive: the Historian pushes each new sample to the tab, the table gains a row at the top, the trend extends, and samples older than the relative start fall off the bottom, so a window of -1m always shows the last minute. Pause freezes both the table and the trend on what they show. Changing the window switches Live off, and Refresh is disabled while Live is on; with Live off, Refresh reloads the window.
The trend#
For a numeric tag a Data Shape trend sits above the table and draws the same samples over the same window, so the two always agree, under Live as well. Collapse it with the chevron on its heading. A string or boolean tag has no trend.
Reading the table#
Newest first. Each row shows:
| Column | What it is |
|---|---|
| Timestamp | Local time, to the millisecond |
| Delta (ms) | The time since the previous sample |
| Formatted | The value as the tag's format and unit of measure display it, for example a boolean shown as its label, or a number to two decimals |
| Delta | The change in value since the previous sample, for numeric tags |
| Raw | The value as stored |
| Quality | The quality byte, coloured by its class |
| Quality Description | The quality in words |
Quality#
The Historian stores an OPC-style quality byte with every sample. Its top two bits decide the class, and the class decides the colour:
| Class | Bytes | Shown as | Colour |
|---|---|---|---|
| Good | 192 to 255 | Good, or Good (Local Override) for a value an operator forced |
Plain text |
| Uncertain | 64 to 127 | Uncertain |
Amber |
| Bad | 0 to 63 | Bad |
Red |
A good value is the normal case and is not highlighted; only the two exceptions draw the eye.
Copying rows#
Copy to clipboard in the header copies every row currently shown as tab-separated text with a header line, in the table's column order including the two delta columns. Paste straight into Excel or Google Sheets and each column lands in its own cell.
Troubleshooting#
| Symptom | Likely cause | What to do |
|---|---|---|
| Nothing in the table although the tag has data | The window does not cover a time when values were recorded. The default is the last minute | Widen the start, for example -1d, or switch to Fixed and pick the period. |
| Rows appear but the trend does not | The tag is not numeric, or the window holds no numeric values | Expected for string and boolean tags. |
| Red quality values you did not expect | The source reported bad quality: a device offline, an OPC UA node in error, a collector writing quality 0 | Look at the collector's log and the source around that time. Good quality returns when the source recovers. |
| Formatted and Raw differ | The tag has a format or a unit-of-measure map | Expected. Edit either on the tag if the display is not what you want; see Managing and Deleting Tags. |
| Live stops adding rows | The window was changed, which switches Live off, or the collector stopped writing | Switch Live back on. If rows still do not arrive, check the dataset's write rate on the Datasets page. |
| Copy produces nothing | The browser refused clipboard access, which needs a secure page | Use the HTTPS address on 4512. |