Querying the Historian with SQL
The Historian can present itself as a PostgreSQL server, so pgAdmin, psql, Python or a SQL Server linked server can read your time-series data with no custom driver.
Overview#
The Historian can answer the PostgreSQL wire protocol. Turn it on and anything that can talk to a
PostgreSQL database, pgAdmin, psql, a Python script, a reporting tool, a SQL Server linked server,
can read your datasets, tags and time-series values in SQL. No Timebase driver, no client library, no
integration work.
It is read-only. Nothing you do over this interface can change or delete historian data.
Five tables are exposed. They are views onto the Historian rather than real tables, so the SQL you can write against them is a deliberately narrow subset: enough to select, filter, sort and limit, and no more. The SQL you can write sets out exactly what is accepted.
This is the right tool when you already have something that reads SQL and you want it pointed at plant history. If you are writing new code, use the Historian REST API instead: it writes as well as reads, manages datasets and tags, streams, and authenticates each caller with its own token.
Read this first: it is already on#
A fresh Historian is listening on port 5432, with a username and password published in this article. There is nothing to switch on. The first thing to do is change the password.
"PGWire": {
  "Enabled": true,
  "Port": 5432,
  "Username": "postgres",
  "Password": "timebase"
}
That is what ships. postgres / timebase is the same on every installation, so treat it as public
knowledge rather than as a credential, until you have replaced it.
What you are accepting while it is on:
- It listens on every network interface on the machine, not on loopback only.
- There is one shared username and password, and it is not tied to Pulse, to a Timebase user or to any role. Everyone who connects is the same reader.
- The password crosses the network in cleartext. The Historian declines TLS on this port, and declines GSS encryption too. A client configured to demand either will not connect.
- It is read-only. Nothing reachable over this port can change or delete historian data, which is what makes an open port an exposure rather than a catastrophe.
So: change the password, keep the port on a trusted network segment, and firewall it to the machines
that need it. If nothing at your site will use it, set Enabled to false and the listener never
opens.
Blanking either credential also closes it. The Historian treats a blank username or password as "closed" rather than as "anonymous", refuses to open the listener, and says so in its log. That is the intended behaviour, not a fault.
Changing the login, or closing the port#
From the interface#
Open Instance Info at the bottom of the sidebar, select Edit beside Configuration, and open the PGWire section:
| Field | What to set |
|---|---|
| Enabled | false closes the port entirely |
| Port | 5432, unless something else on the machine already uses it |
| Username | A name you choose |
| Password | A password you choose |
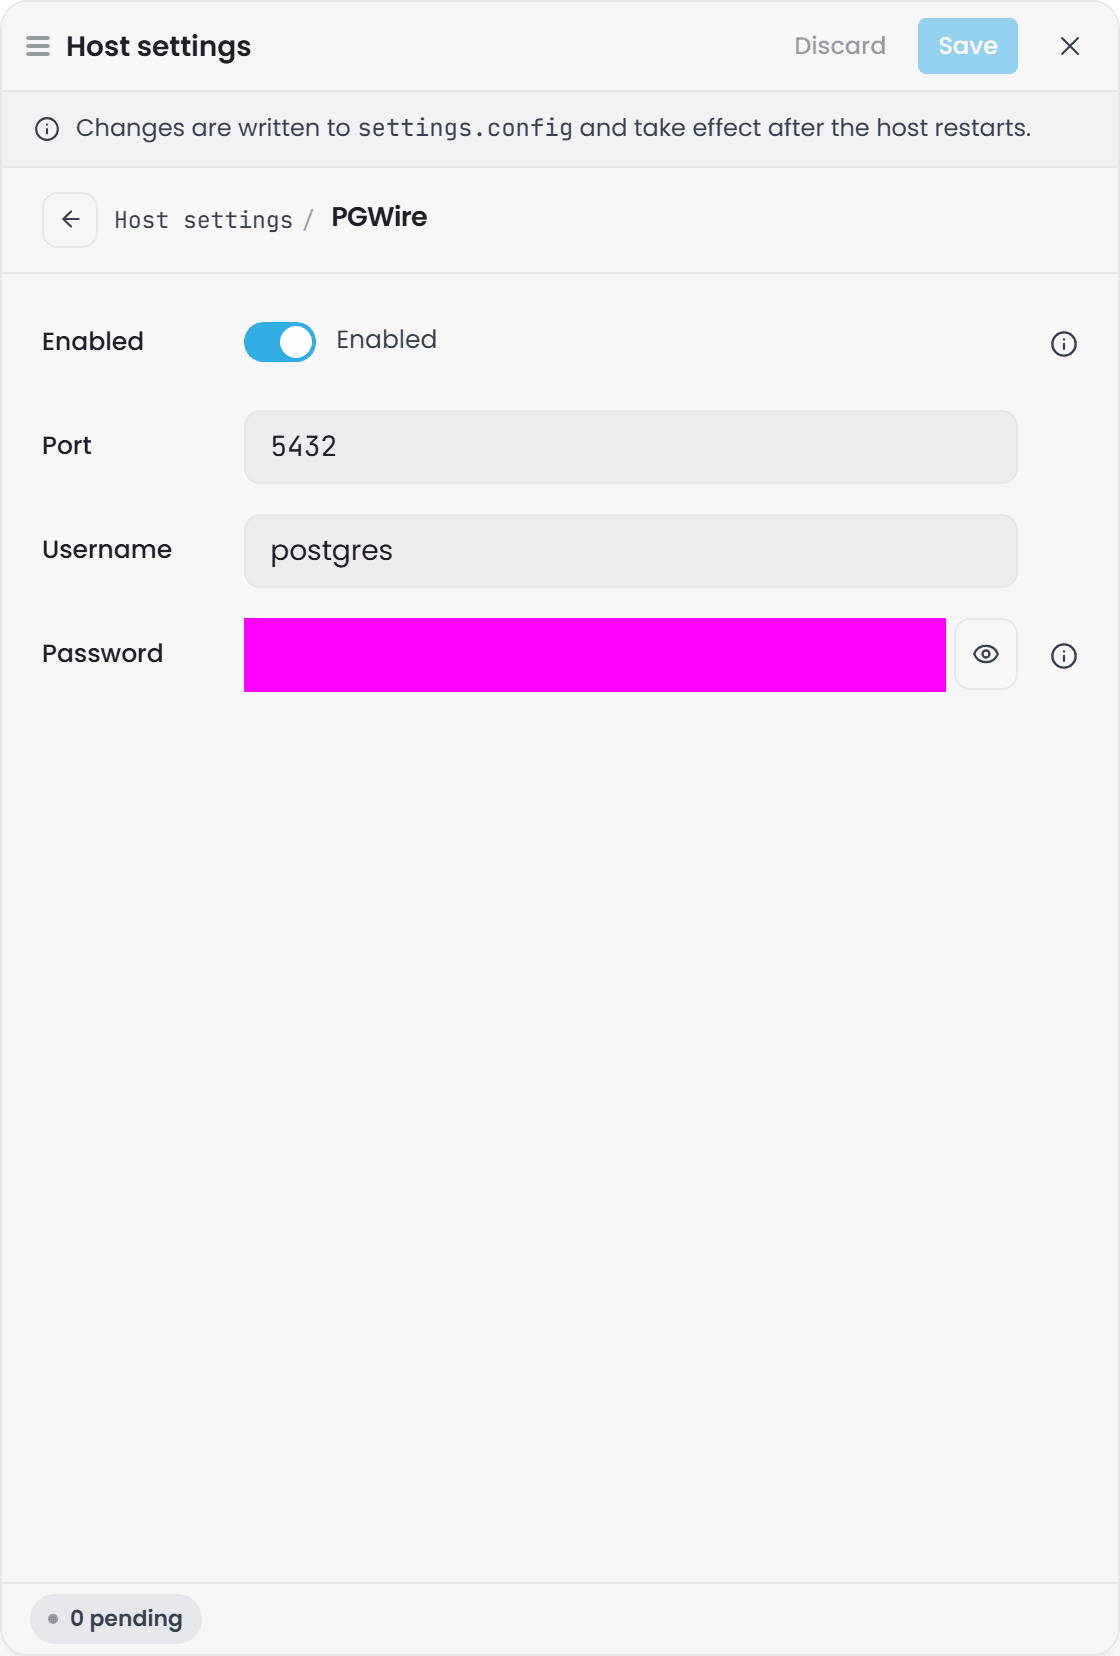
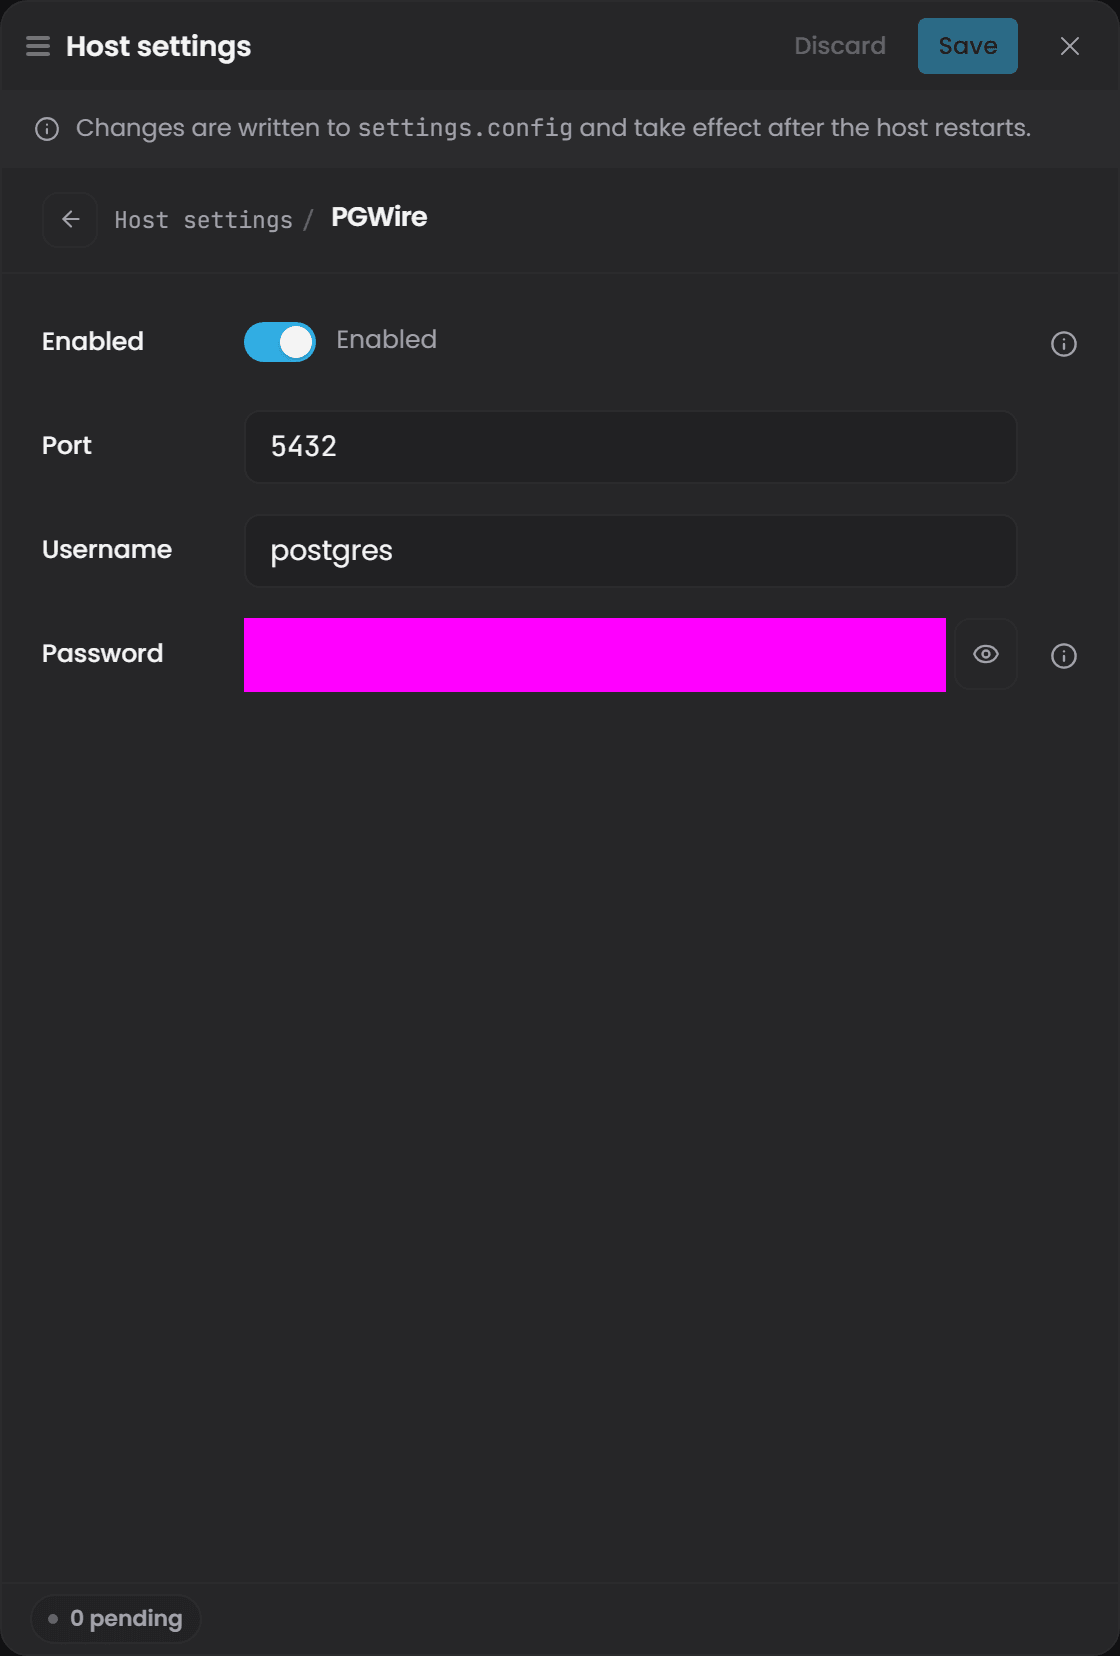
Save, then restart the Historian. This listener reads its settings once at startup, so no change here takes effect until it does, including closing it.
In settings.config#
"PGWire": {
  "Enabled": true,
  "Port": 5432,
  "Username": "<YourPgWireUserHere>",
  "Password": "<YourPgWirePasswordHere>"
}
An installation upgraded from a release that predates this section gains it, and gains it closed with blank credentials rather than open on the shipped login. Only a fresh installation starts with the port open.
In Docker#
Publish the port as well. The shipped compose file maps the Historian's two HTTP ports and nothing else, so add the third:
    ports:
      - "4511:4511"
      - "4512:4512"
      - "5432:5432"
If the host already runs PostgreSQL, map it somewhere else ("15432:5432") and point your client at
that.
Connecting#
Any PostgreSQL client, using postgres / timebase until you change them. Five details are worth
knowing before your first attempt:
- The database name is ignored. The Historian accepts whatever you send.
historianreads well in a connection list, so the examples use it, but nothing checks it. - Encryption is declined. Set your client's SSL mode to
disableorprefer. A client set torequirewill fail to connect, and that is the connection error people hit first. - The Historian reports itself as PostgreSQL 16. That is what keeps tools that check a version happy; it does not mean the full feature set of PostgreSQL 16 is available.
- A wrong password comes back as a normal PostgreSQL authentication failure, so your client will report it the way it reports any other.
- JDBC clients work. The Historian answers named prepared statements and binary result formats, which is what a pgJDBC-based tool (DBeaver, HighByte, most Java reporting tools) reaches for as soon as a statement is prepared. Earlier builds had neither and those clients failed on the second query rather than the first.
The recipes below use <YourPgWireUserHere> rather than the shipped postgres, on the assumption
you have changed it. If you have not yet, that is the first thing to do.
psql#
psql -h <YourHistorianServerHere> -p 5432 -U <YourPgWireUserHere> -d historian
pgAdmin#
-
Right-click Servers, then Register, then Server.
-
On the General tab, name it something recognisable, for example
Timebase Historian. -
On the Connection tab:
Field Value Host <YourHistorianServerHere>Port 5432Maintenance database historianUsername <YourPgWireUserHere>Password The password you configured -
Save. The five tables appear under Schemas, then public, then Tables.
-
Query them from Tools, then Query Tool.
Python#
import psycopg2

conn = psycopg2.connect(
    host="<YourHistorianServerHere>",
    port=5432,
    dbname="historian",
    user="<YourPgWireUserHere>",
    password="<YourPgWirePasswordHere>",
)

with conn.cursor() as cur:
    cur.execute("""
        SELECT * FROM data
        WHERE dataset = 'OPCUA Demo'
          AND tag = 'Time.Second'
          AND timestamp >= '2026-05-19T00:00:00Z'
        ORDER BY timestamp DESC
        LIMIT 100
    """)
    for row in cur.fetchall():
        print(row)

conn.close()
A SQL Server linked server#
This lets you read plant history from T-SQL, which is often the shortest path into an existing report.
-
Install the 64-bit psqlODBC driver on the SQL Server machine, from
odbc.postgresql.org. -
Create a System DSN. Open ODBC Data Sources (64-bit), then System DSN, then Add, and choose PostgreSQL Unicode:
Field Value Data Source TimebaseHistorianServer <YourHistorianServerHere>Port 5432Database historianUsername <YourPgWireUserHere> -
Register the linked server:
EXEC sp_addlinkedserver @server = 'TIMEBASE_HISTORIAN', @srvproduct = 'PostgreSQL', @provider = 'MSDASQL', @datasrc = 'TimebaseHistorian'; EXEC sp_addlinkedsrvlogin @rmtsrvname = 'TIMEBASE_HISTORIAN', @useself = 'FALSE', @locallogin = NULL, @rmtuser = '<YourPgWireUserHere>', @rmtpassword = '<YourPgWirePasswordHere>'; EXEC sp_serveroption 'TIMEBASE_HISTORIAN', 'rpc out', true; -
Query through
OPENQUERY. Single quotes inside the passed-through statement are doubled:SELECT * FROM OPENQUERY(TIMEBASE_HISTORIAN, 'SELECT * FROM datasets') SELECT * FROM OPENQUERY(TIMEBASE_HISTORIAN, 'SELECT * FROM data WHERE dataset = ''OPCUA Demo'' AND tag = ''Time.Second'' AND timestamp >= ''2026-05-19T00:00:00Z'' ORDER BY timestamp DESC LIMIT 100')
SQL Server in a container cannot see a Windows System DSN. Install
odbc-postgresqlinside the container, add the same DSN to its/etc/odbc.ini, and reach the Historian onhost.docker.internal, addingextra_hosts: ["host.docker.internal:host-gateway"]to the container's compose entry if that name does not resolve. Both the DSN entry and the linked-server registration are lost when the container is recreated, so mount the file or bake it into an image if you want the setup to survive.
The five tables#
datasets#
One row per configured dataset. Takes no filters.
| Column | Type | Description |
|---|---|---|
name |
text | Dataset name |
size_gb |
float8 | Approximate size on disk, in GB |
tag_count |
int8 | Number of tags in the dataset |
age_days |
float8 | Age of the oldest record, in days |
tags#
One row per tag. Filter by dataset, or omit the filter to read every dataset.
| Column | Type | Description |
|---|---|---|
dataset |
text | Parent dataset |
name |
text | Tag name |
description |
text | Tag description |
data_type |
text | Tag data type, for example Float or Integer |
tag_type |
text | Tag category |
tag_fields#
One row per metadata field per tag.
| Column | Type | Description |
|---|---|---|
dataset |
text | Parent dataset |
tag |
text | Tag name |
key |
text | Field name |
value |
text | Field value |
tag_uom#
One row per unit-of-measure entry per tag.
| Column | Type | Description |
|---|---|---|
dataset |
text | Parent dataset |
tag |
text | Tag name |
key |
int4 | Unit index |
unit |
text | Unit label, for example °C or bar |
data#
Raw timestamp, value and quality records.
| Column | Type | Description |
|---|---|---|
dataset |
text | Dataset name |
tag |
text | Tag name |
timestamp |
timestamptz | Sample timestamp, UTC |
value |
float8 | Sampled value |
quality |
int4 | Quality code |
datais the one table with a required filter. Every query against it must name adatasetand at least one tag. Leave either out and the query is refused with a message telling you the shape it wants. This is on purpose: an unfiltered read of a plant's entire history is not a query anyone means to run.
Two behaviours of data worth knowing before you write queries:
- No timestamp filter returns only the latest point per tag, matching the REST API. To read
history, always give at least a lower
timestampbound. - Results are window-exact: rows satisfy the timestamp predicates you wrote, and
count(*)counts exactly those rows. (The REST and i3X APIs return one extra leading element - the last value before the window, for last-known-value semantics - which SQL deliberately does not.)
The SQL you can write#
SELECT#
SELECT *, or a list of the columns you want, with AS aliases if you want them:
SELECT tag, timestamp, value AS reading FROM data WHERE ...
SELECT count(*) works as well, with or without an alias, and is the cheap way to size a result
before you fetch it.
An expression the engine cannot honour, a function call, a cast or DISTINCT, is refused rather
than quietly answered with the full row. That refusal is deliberate: returning columns you did not ask
for breaks positional getters and result-set metadata in every JDBC tool.
WHERE#
| Filter | Tables | Example |
|---|---|---|
dataset = 'name' |
all except datasets |
WHERE dataset = 'OPCUA Demo' |
name = 'value' |
datasets, tags |
WHERE name = 'Time.Second' |
tag = 'name' |
data, tag_fields, tag_uom |
WHERE tag = 'Time.Second' |
tag IN ('a', 'b') |
data |
WHERE tag IN ('Tag1', 'Tag2') |
timestamp >= / > 'value' |
data |
WHERE timestamp > '2026-01-01T00:00:00Z' (strict > excludes a point exactly at the bound) |
timestamp <= / < 'value' |
data |
WHERE timestamp < '2026-01-01T06:00:00Z' |
Timestamps must be ISO 8601 strings. On tags, tag_fields and tag_uom the dataset filter is
optional, and leaving it out reads every dataset.
Anything else in a WHERE clause is refused, never silently dropped. A predicate the engine
cannot evaluate - value > 13, quality = 999, LIKE, OR, a filter column the table does not
support, an unreadable timestamp literal - returns an error naming the offending text. The refusal
is the same promise the select list makes: a silently dropped predicate hands back rows that do not
match your filter, and a reporting tool or scheduled query would never notice.
ORDER BY, LIMIT and OFFSET#
ORDER BY <column> [ASC | DESC]
LIMIT <n> OFFSET <m>
Sorting is numeric where the column holds numbers and case-insensitive text everywhere else, and
ascending unless you say otherwise. OFFSET skips rows after the sort and LIMIT trims what
remains, in PostgreSQL's order, so pages read the way you would expect.
What is not supported#
Everything in this table is refused with an error rather than silently ignored:
| Feature | Notes |
|---|---|
JOIN, multiple tables in FROM |
One table per query |
Aggregation beyond count(*) |
No GROUP BY, HAVING, SUM, AVG, MIN or MAX |
INSERT, UPDATE, DELETE, DDL |
The interface is read-only; only SELECT runs |
Subqueries, UNION |
Not supported |
| Transactions | BEGIN, COMMIT and ROLLBACK are accepted and do nothing |
| Schemas | A schema.table prefix is accepted and ignored. Only the implicit public schema exists (\dt in psql lists the five tables) |
| Multiple statements | One statement per query (a trailing ; is fine) |
Aggregate where the data lands rather than here: pull the rows you need and let your reporting tool,
your script or your SQL Server do the arithmetic. count(*) is the one exception, because sizing a
result before fetching it is worth not fetching it for.
Sample queries#
Every dataset, largest first
SELECT * FROM datasets
ORDER BY size_gb DESC
Every tag in one dataset
SELECT * FROM tags
WHERE dataset = 'OPCUA Demo'
ORDER BY name ASC
Every tag across every dataset
SELECT * FROM tags
ORDER BY dataset, name
Metadata fields and units for a dataset
SELECT * FROM tag_fields
WHERE dataset = 'OPCUA Demo'

SELECT * FROM tag_uom
WHERE dataset = 'OPCUA Demo'
A day of one tag
SELECT * FROM data
WHERE dataset = 'OPCUA Demo'
  AND tag = 'Time.Second'
  AND timestamp >= '2026-05-19T00:00:00Z'
  AND timestamp < '2026-05-20T00:00:00Z'
ORDER BY timestamp ASC
Several tags at once, capped
SELECT * FROM data
WHERE dataset = 'OPCUA Demo'
  AND tag IN ('Time.Second', 'Time.Minute', 'Time.Hour')
  AND timestamp >= '2026-05-19T00:00:00Z'
  AND timestamp < '2026-05-20T00:00:00Z'
ORDER BY timestamp ASC
LIMIT 1000
The latest hundred samples
A lower bound is required to read history - without a timestamp filter the engine returns only the single latest point. Give a bound generous enough to cover a hundred samples:
SELECT * FROM data
WHERE dataset = 'OPCUA Demo'
  AND tag = 'Time.Second'
  AND timestamp >= '2026-05-19T00:00:00Z'
ORDER BY timestamp DESC
LIMIT 100
Troubleshooting#
| What you see | Why | What to do |
|---|---|---|
| Connection refused, and the Historian is running | The listener is off, or it is on with a blank username or password | Check the Historian log. It says plainly when it declined to listen for want of credentials. Fill in both and restart |
| Connection refused from another machine, fine locally | The port is not reachable | In Docker, publish 5432. Otherwise open it on the firewall |
| The client reports an SSL or encryption failure | The client demands TLS, which this port declines | Set SSL mode to disable or prefer |
| Password authentication failed | Wrong username or password, or the Historian was not restarted after you set them | The listener reads its settings at startup only. Restart it |
| The port is already in use | PostgreSQL is installed on the same machine | Change Port, or in Docker map a different host port to 5432. The Historian retries the bind for about 30 seconds, then logs one error and carries on without PGWire: the rest of the Historian is unaffected, so a taken port costs you this interface and nothing else |
data queries require ... |
A data query named no dataset, or no tag |
Add both. data is the one table that insists |
A SELECT with a function, a cast or DISTINCT is refused |
Only plain columns and count(*) can be projected |
Select the columns raw and compute downstream. The refusal is deliberate: answering with the wrong columns breaks JDBC metadata silently |
An aggregate other than count(*) fails |
No GROUP BY, SUM, AVG, MIN or MAX here |
Select the rows and aggregate in your own tool |
| A change to the settings had no effect | These settings are read at startup | Restart the Historian |
Related articles#
| Article | What it covers |
|---|---|
| Introduction to the Time Series Historian | Datasets, tags and how the store is organised |
| Time Series Historian Settings | The rest of the settings on this host |
| Historian Dataset Tag Query Filters | The filter language in the Historian's own tag browser |
| Component Settings | Where settings.config lives and how the editor works |
| Timebase Historian REST API | The authenticated read and write API: dataset and tag management, streaming, a token per caller |