Changing The Verbosity Of Timebase Logging
When you need to diagnose a problem, you can increase the verbosity for specific components without touching anything else.
Overview#
All four Timebase products - Historian, Collector, Explorer, and Pulse - use the same logging system. Logs are written to a rolling daily file and to the console (or Windows service output). A live log viewer is also available inside each product's web interface. By default, only informational and higher-severity messages from Timebase itself are shown; third-party library output is limited to warnings and errors. When you need to diagnose a problem, you can increase the verbosity for specific components without touching anything else.
Where Logs Are Written#
Each product writes to the same three destinations simultaneously:
| Destination | Details |
|---|---|
| Rolling log file | One file per day, kept for 7 days. Older files are deleted automatically. |
| Console / service output | Visible when running in a terminal, or in service console output. |
| In-browser log viewer | Live view inside each product's web interface. Shows the last 1,000 log entries from the current session only - not persisted. |
Log file locations#
| Product | Windows path | Docker path |
|---|---|---|
| Historian | C:\ProgramData\Flow Software\Timebase\Historian\Logs\ |
/logs/ |
| Collector | C:\ProgramData\Flow Software\Timebase\Collector\Logs\ |
/logs/ |
| Explorer | C:\ProgramData\Flow Software\Timebase\Explorer\Logs\ |
/logs/ |
| Pulse | C:\ProgramData\Flow Software\Timebase\Pulse\Logs\ |
/logs/ |
Log filenames include the date, e.g. 20260503.txt. The path can be changed by setting the Logs key in settings.config or via environment variable.
How to Change the Log Level#
Each product reads its log level from a settings.config file. Edit the Serilog section directly - the change takes effect immediately without restarting the service.
Settings file locations#
| Product | Windows path |
|---|---|
| Historian | C:\ProgramData\Flow Software\Timebase\Historian\Settings\settings.config |
| Collector | C:\ProgramData\Flow Software\Timebase\Collector\Settings\settings.config |
| Explorer | C:\ProgramData\Flow Software\Timebase\Explorer\Settings\settings.config |
| Pulse | C:\ProgramData\Flow Software\Timebase\Pulse\Settings\settings.config |
Docker: /settings/settings.config (mapped from the product's settings volume)
The Serilog section#
The Serilog section in settings.config controls which messages are shown:
"Serilog": {
  "MinimumLevel": {
    "Default": "Warning",
    "Override": {
      "Timebase.Historian": "Information",
      "Timebase.Dataset": "Information"
    }
  }
}
Default- the minimum level for everything not listed inOverride. Keep this atWarningto suppress noise from ASP.NET Core and other libraries.Override- per-namespace level settings. The product's own namespace is listed here so its messages appear atInformationby default.
Available log levels#
Levels in order from least to most severe:
| Level | When to use |
|---|---|
Verbose |
Maximum detail - individual data points, internal loop iterations. Very high volume. |
Debug |
Detailed data flow - chunk sizes, batch results, connection events. Use for active diagnosis. |
Information |
Normal operation milestones. This is the default for Timebase code. |
Warning |
Recoverable problems - connection retries, token refresh, buffer activation. |
Error |
Failures that need attention but did not stop the service. |
Fatal / Critical |
Startup failures that caused the service to exit. |
Namespace overrides for each product#
Use these namespace values in the Override section of settings.config:
| Product | Namespace | What it covers |
|---|---|---|
| Historian | Timebase.Historian |
Historian service, datasets, API |
| Historian | Timebase.Dataset |
Individual dataset operations |
| Collector | Timebase.Collector |
Collector service and all plugins (OPC UA, MQTT, SparkplugB, etc.) |
| Collector - OPC UA only | Timebase.Collector.OPCUA |
OPC UA plugin exclusively |
| Collector - MQTT only | Timebase.Collector.MQTT |
MQTT plugin exclusively |
| Collector - SparkplugB only | Timebase.Collector.SparkplugB |
SparkplugB plugin exclusively |
| Explorer | Timebase.Explorer |
Explorer service, proxy, historian client |
| Pulse | Timebase.Pulse |
Pulse service, authentication, certificates |
To set a level for all Timebase code across every namespace at once, use the parent namespace:
"Override": {
  "Timebase": "Debug"
}
Alternate methods#
You can also change the log level without editing settings.config by hand:
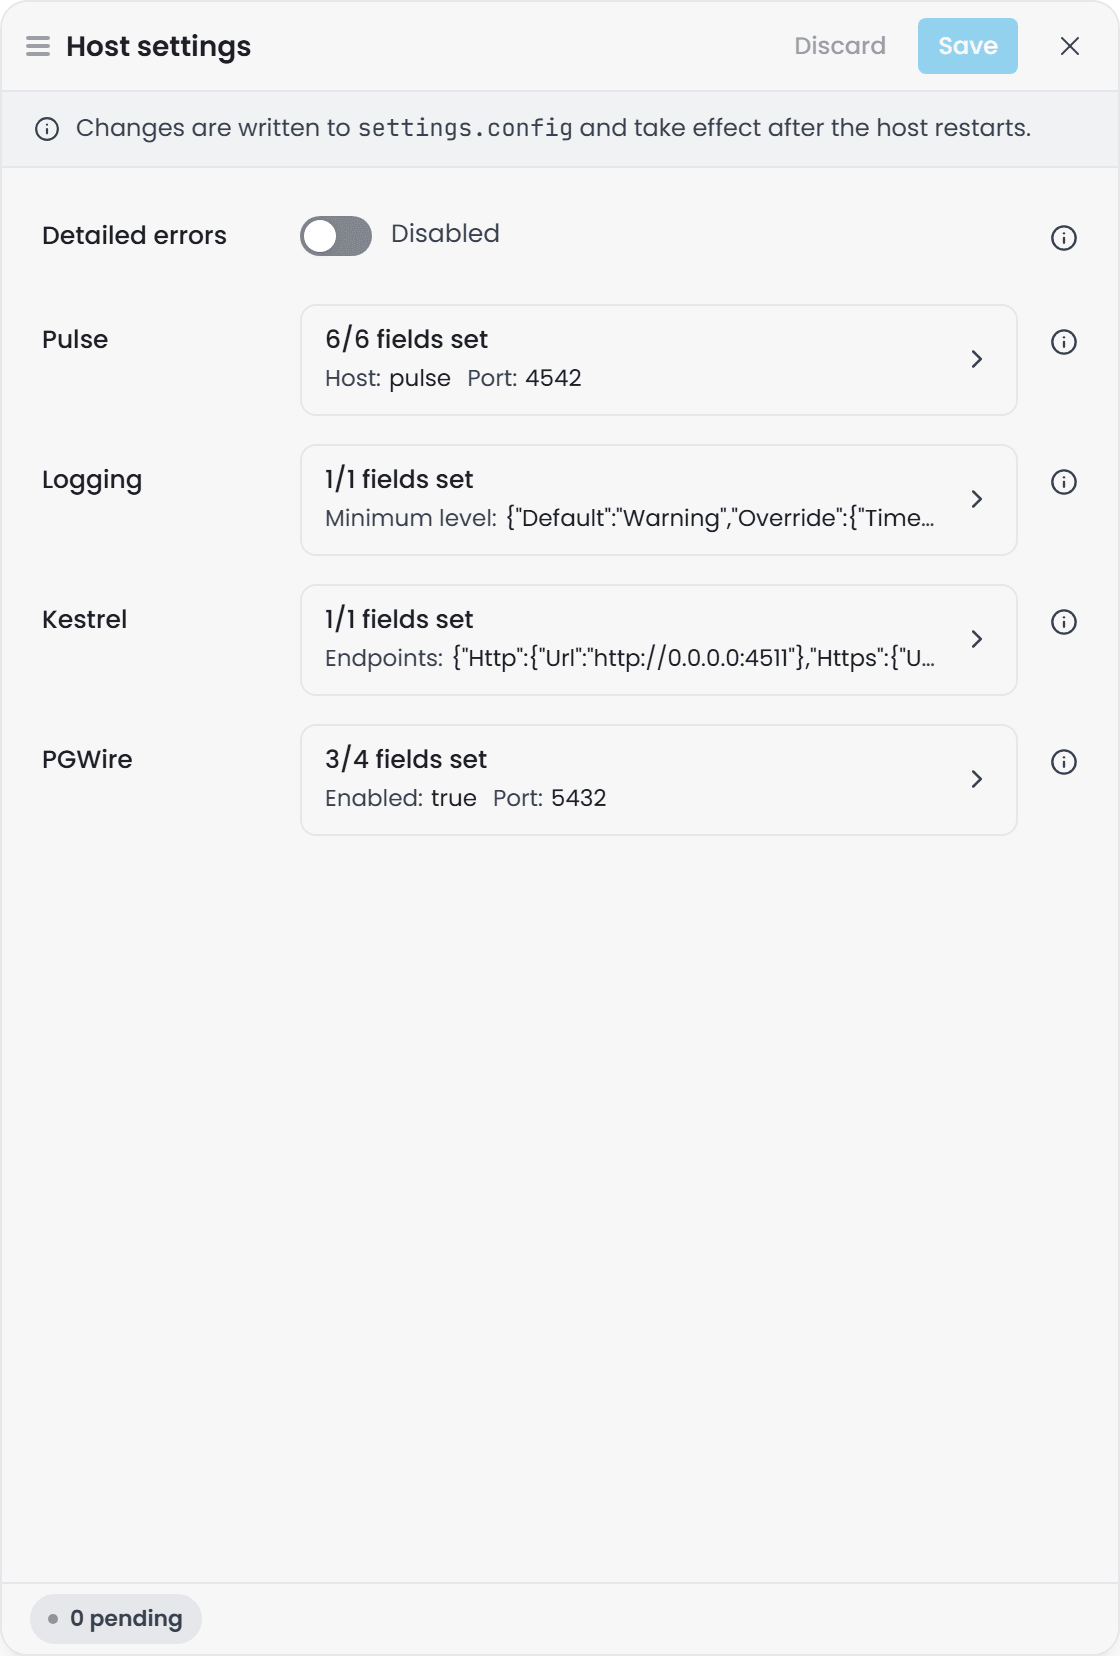
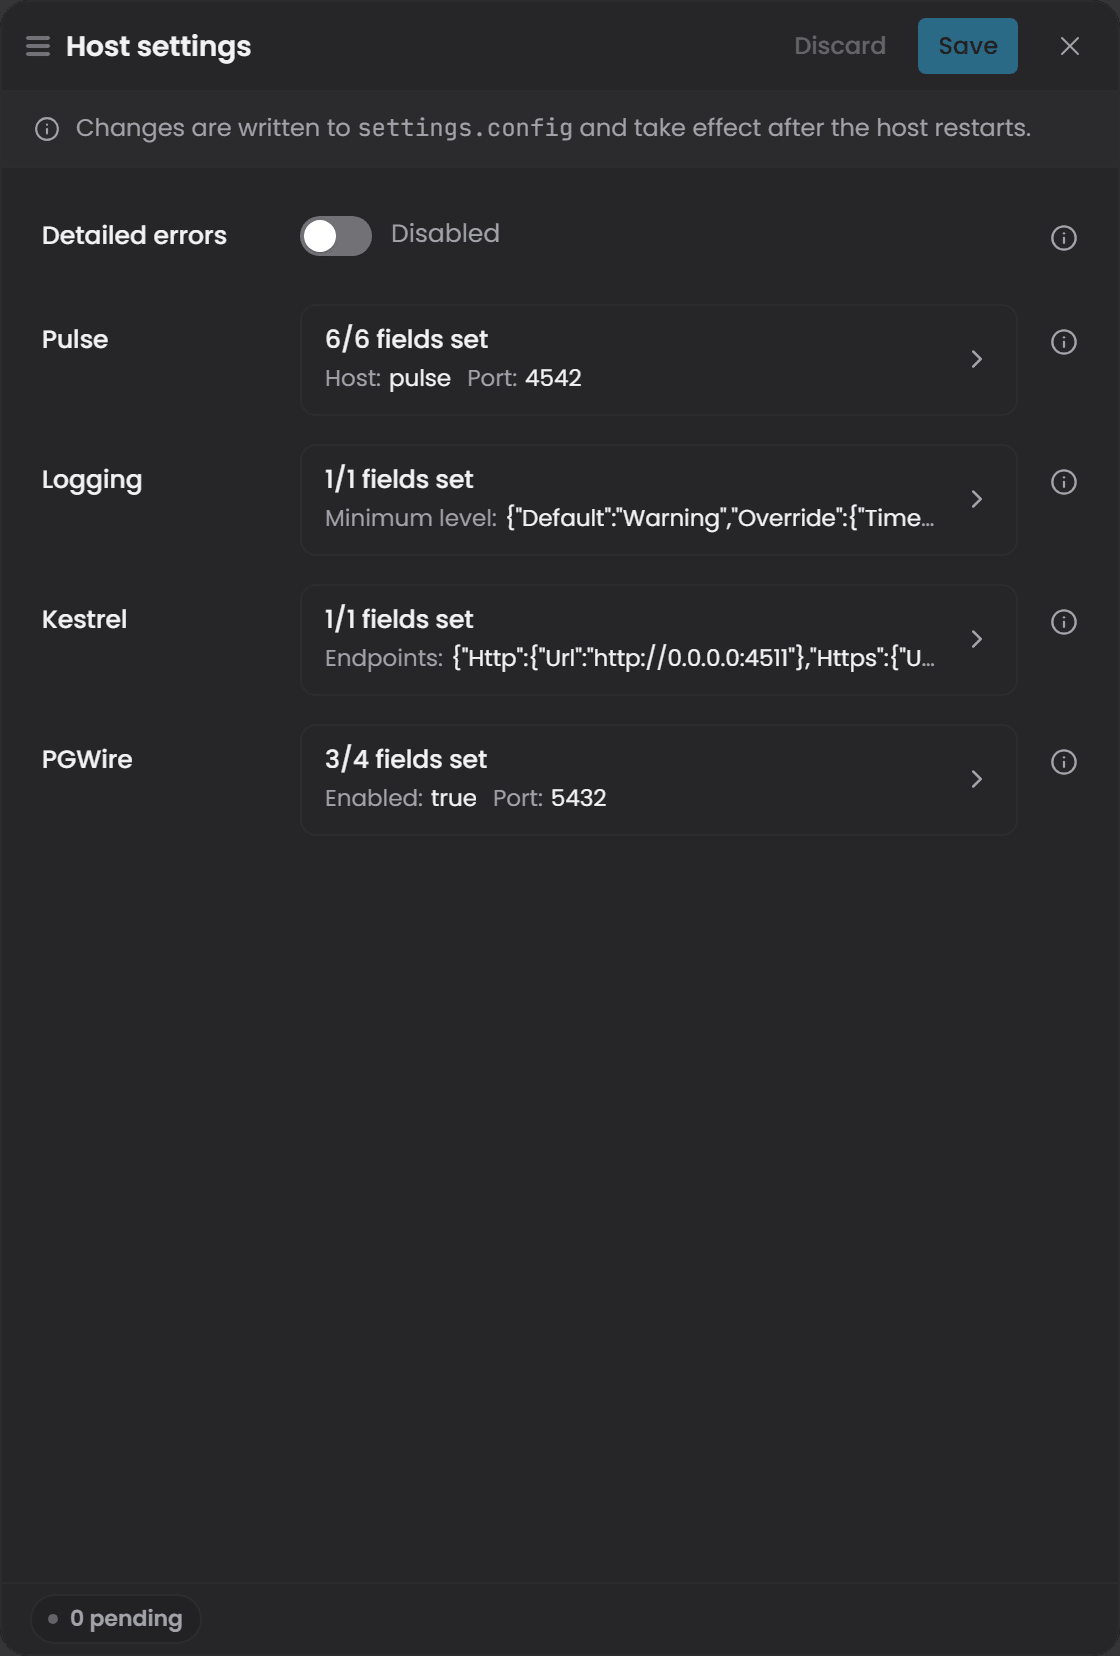
Host settings editor. Every component's Instance Info page has an Edit button beside Configuration. Its Logging section holds the same Serilog minimum levels and writes them to settings.config for you; the editor notes that its changes take effect after the host restarts.
Environment variable (takes effect on next restart):
Serilog__MinimumLevel__Default=Debug
Serilog__MinimumLevel__Override__Timebase.Historian=Debug
Docker compose:
environment:
  - Serilog__MinimumLevel__Override__Timebase.Historian=Debug
Command-line argument (highest precedence, overrides everything):
--Serilog:MinimumLevel:Default=Debug
What Each Level Shows#
Historian#
Information (default)
| Message | What it means |
|---|---|
Historian starting ... |
Service is starting |
Historian 'Auth' configured as {Url} for '{ClientId}' |
OAuth2 authentication is active |
Historian 'Auth' disabled |
Running without authentication |
Historian started |
Fully initialized, all datasets loaded |
Process listening on {Urls} |
API is accepting requests |
Historian tags: {Count} |
Daily diagnostic summary |
Historian size: {Size} GB |
Storage summary |
Historian space available: {Space} GB ({Percent}%) |
Disk space check |
Historian removed dataset {DatasetName} |
Dataset deleted |
Warning
| Message | What it means |
|---|---|
Historian dataset {Dataset} collector has timed out, entering "store forward" state |
Collector disconnected - data will buffer |
Historian dataset {Dataset} collector has lost communication |
Extended collector disconnect |
Dataset directory for {DatasetName} not found at {Path} |
Dataset directory missing on disk |
Debug - Data flow messages: HTTP request details, chunk dispatch timing.
Collector#
Information (default)
| Message | What it means |
|---|---|
Collector starting ... |
Service is starting |
Collector plugin {Plugin} starting ... / started |
Plugin lifecycle |
Collector started |
All plugins running |
OPCUA plugin successfully created session |
OPC UA connected |
OPCUA plugin subscription cycle finished in {Elapsed}ms, {Matched} nodes matched, {Subscribed} total subscribed |
Node browsing complete |
OPCUA plugin Subscription[{Index}] now monitoring {Count} nodes |
Active subscriptions |
Client {name} store and forward deactivated for dataset {Dataset} |
Historian reconnected, buffer drained |
Client {name} tag cache successfully populated for dataset {Dataset} with {Count} tags |
Tag cache ready |
Warning
| Message | What it means |
|---|---|
Collector is running, but 'Active' setting is set to false, data collection is paused |
Collection intentionally paused |
OPCUA plugin failed to create session: {Exception} |
OPC UA connection failed - retrying every 10 seconds |
OPCUA plugin failed to read DataType for node {NodeId} |
Node skipped - check OPC UA server |
OPCUA plugin keep alive status: {KeepAlive} |
Keep-alive issue detected |
Client {name} hub connection to {BaseAddress} has disconnected |
Lost connection to Historian |
Client {name} store and forward activated for dataset {Dataset}. Buffered {Buffer} points |
Historian unreachable - buffering data |
MQTT plugin connection to {Broker}:{Port} failed: {Reason} |
MQTT connection error |
SparkplugB plugin Data Received before birth |
SparkplugB sequence issue |
Critical (plugin startup failures)
| Message | What it means |
|---|---|
Collector plugin {Plugin} failed to start: {Exception} |
Plugin failed - check configuration |
Collector '{Setting}' is not configured |
Required setting is missing |
Debug - Chunk-level write detail: sending chunk for dataset {Dataset}: {Chunk} points for {Tags} tags, write timing, buffering rate.
Verbose - Individual data point trace: buffered {Tag} value {Value}: Message {SequenceNumber}. Very high volume - use only for a single tag.
Explorer#
Information (default)
| Message | What it means |
|---|---|
Explorer starting ... |
Service is starting |
Explorer initialized |
Configuration loaded |
Process listening on {Urls} |
UI is accepting requests |
Source proxy service configuration reloaded |
Historian proxy updated |
Client {name} hub reconnected to {BaseAddress}: {ConnectionId} |
Reconnected to Historian |
Warning
| Message | What it means |
|---|---|
Client {name} hub connection to {BaseAddress} has disconnected |
Lost connection to Historian |
Client {name} store and forward activated for dataset {Dataset} |
Historian unreachable |
Client {name} failed to send status data to {BaseAddress} |
Status update failed |
Critical (startup failures)
| Message | What it means |
|---|---|
Explorer 'Historians' is not configured |
No historian defined in config |
Explorer Historian[{Index}] 'Host' is not configured |
Historian host missing |
Explorer configuration could not be loaded |
Config file unreadable |
Debug - Historian client connection detail, SignalR reconnect events, HTTP proxy request/response timing.
Pulse#
Information (default)
| Message | What it means |
|---|---|
Pulse starting ... |
Service is starting |
Pulse created {Count} default clients in {Object} |
Default OAuth2 clients seeded |
Pulse started |
Ready to handle authentication requests |
Process listening on {Urls} |
Accepting requests |
Certificates generated certificate: {Subject}, expires {Expiry} |
TLS certificate created or renewed |
RootCA Root CA generated and saved: {Subject}, expires {Expiry} |
Root CA created |
RootCA installed Root CA to OS trust store: {Subject} |
Root CA trusted by OS |
Warning
| Message | What it means |
|---|---|
JWT Challenge triggered. Authentication scheme: {AuthScheme}, Error: {Error} |
A request failed authentication |
RootCA failed to install Root CA to OS trust store |
Manual trust store installation may be needed |
Skipping key due to missing private key material or ID |
A signing key is malformed |
Error
| Message | What it means |
|---|---|
JWT Authentication Failed |
Token validation failed - check client credentials and Pulse URL |
No signing keys found in storage. JWT validation will fail |
Key store is empty - restart Pulse to regenerate keys |
No validation keys provided by IKeyProvider |
Key provider returned nothing |
Debug - JWT validation detail per request, OAuth2 authorization code flow steps, configuration reload notifications.
Common Diagnostic Scenarios#
Collector not delivering data to Historian#
- Set
Timebase.CollectortoDebugin the Collector'ssettings.config. - Look for
sending chunk for dataset ...- if absent, data is not reaching the write client. - Look for
store and forward activated- this means the Historian is unreachable from the Collector. - Verify the Historian URL and port in the Collector configuration.
Historian shows gaps in tag data#
- Check the Historian's log for
dataset {Dataset} collector has timed out- this marks when the Collector disconnected. - Check the Collector's log for
hub connection to {BaseAddress} has disconnectedaround the same time. - If Store and Forward was active, look for
store and forward deactivatedto confirm data was recovered on reconnection.
OPC UA tags not appearing or not updating#
- Set
Timebase.Collector.OPCUAtoDebugin the Collector'ssettings.config. - Look for
subscription cycle finished in {Elapsed}ms, {Matched} nodes matched- ifMatchedis 0, no configured tags matched any OPC UA nodes. Check the tag filter configuration. - Look for
failed to read DataType for nodewarnings - these nodes are skipped and will not collect data. - If the connection itself is failing, look for
failed to create sessionand check the OPC UA server address and security settings.
Pulse authentication errors#
- Set
Timebase.PulsetoDebugin the Pulsesettings.config. - Look for
JWT Authentication Failed- this means the token presented was invalid. - Look for
No signing keys found in storage- if present, restart Pulse to regenerate the key store. - Look for
JWT Token Validated successfullyto confirm a successful validation is occurring for the expected principal.
Explorer cannot connect to Historian#
- Check Explorer logs for
Explorer Historian[{Index}] 'Host' is not configuredat startup. - Look for
Client {name} hub connection to ... has disconnectedto find when the disconnection occurred. - Verify the Historian address in the Explorer
settings.configunder theHistorianssection.